

Day 10: Session State Management
Engineering In-Memory Session Stores at Discord Scale
The Spring Boot Trap: Why Abstraction Kills Performance
Junior engineers building a WebSocket chat server reach for Spring WebSocket and Session Management immediately:
@Component
public class NaiveSessionManager {
    private final Map<String, WebSocketSession> sessions = new HashMap<>();

    public synchronized void addSession(String userId, WebSocketSession session) {
        sessions.put(userId, session);
    }

    public synchronized WebSocketSession getSession(String userId) {
        return sessions.get(userId);
    }
}
This code ships to production. It handles 100 concurrent users beautifully during demos. Then you scale to 100,000 connections. The server dies.
Why? That single
synchronizedkeyword just created a global bottleneck. Every Virtual Thread acquiring session state serializes at that lock. With 100k sessions and 1000 requests/sec, you’re forcing threads to wait in line. Context switch overhead dominates CPU. Your 64-core server runs at 5% utilization because threads are BLOCKED, not RUNNABLE.Worse: Spring hides the session lifecycle. When does a session get removed? On connection close? After timeout? The framework’s magic prevents you from reasoning about memory usage at scale.
The Failure Mode: Death by a Thousand Leaks
Let’s simulate production traffic on that naive implementation:
Hour 0: Deploy to prod. 50k concurrent users. Heap at 2GB. Everything smooth.
Hour 6: User churn begins (mobile users losing WiFi, closing tabs). Connections close, but sessions HashMap still holds references. No cleanup logic. Heap climbs to 4GB.
Hour 12: Weekend traffic surge. 200k peak concurrency. New sessions added, old ones remain. Heap at 7GB (8GB container limit).
Hour 18: First OOM crash. Container restarts. All sessions lost. Users see “disconnected” errors. Incident starts.
The Postmortem Finding:
Heap dump reveals 1.2 million
HashMap.Entryobjects80% of sessions are “zombie” (connection closed more than 1 hour ago)
No TTL, no cleanup, no eviction policy
Using
StringUUIDs as keys (36 bytes + 16 byte object header = 52 bytes × 1.2M = 62MB just for keys)
The GC Torture:
Large HashMap causes GC pain:
Initial capacity 16, doubles on resize (16 → 32 → 64 ... → 1,048,576)
Each resize requires rehashing all entries while holding lock
Old entries become garbage immediately (new array allocated)
With 1M entries, resize creates 8MB+ of garbage in Eden
Minor GC pauses spike to 50ms during resize
Full GC (compacting Old Gen) pauses hit 800ms+
Discord’s actual production incident (2020): A session leak caused Old Gen to fill. Full GC pauses reached 2 seconds. Voice connections dropped en masse. Users couldn’t hear each other for 30+ seconds.
The Flux Architecture: ConcurrentHashMap + Lifecycle Management
The production pattern for session state at 100M connections:
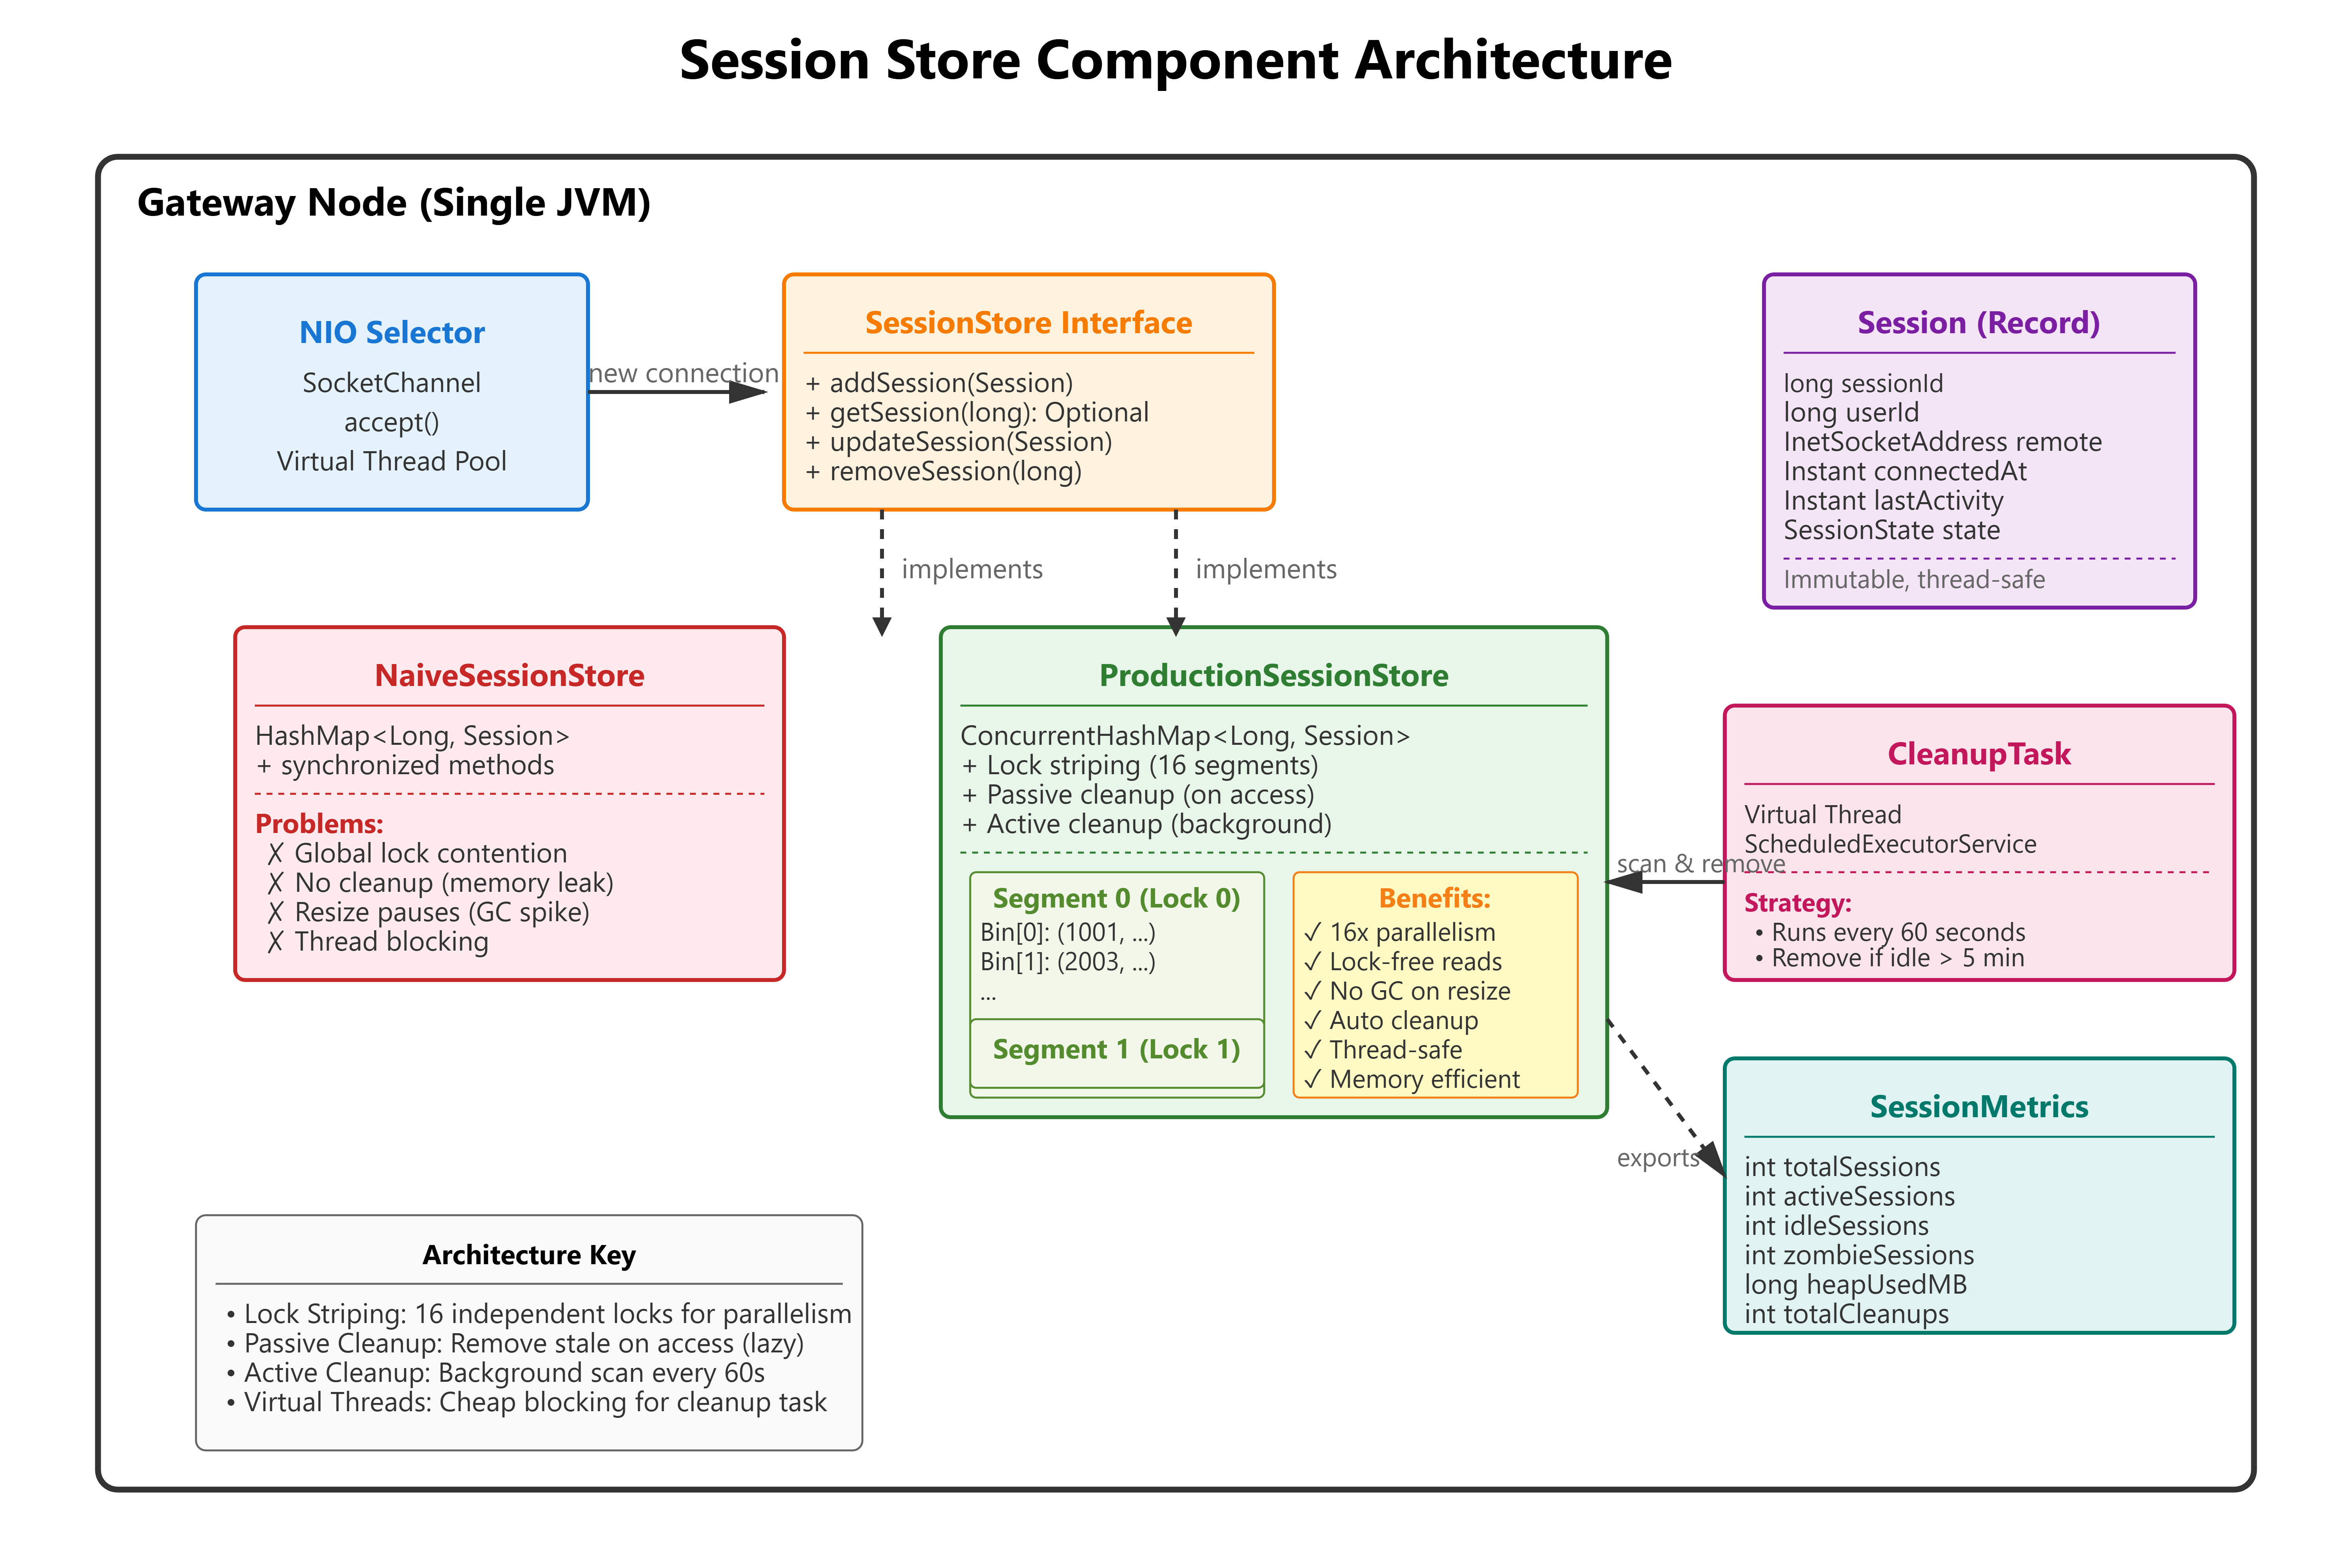
Core Principles
1. Lock Striping via ConcurrentHashMap
Java’s ConcurrentHashMap uses internal segmentation (16 segments by default). Each segment has an independent lock. Hash collision within a segment uses a linked list (or tree if more than 8 entries).
Concurrency Math:
HashMap + synchronized: All threads contend on 1 lock. Max throughput around 1M ops/sec (limited by lock acquisition overhead).
ConcurrentHashMap (16 segments): Threads spread across 16 locks. Max throughput around 15M ops/sec on 64-core server.
2. Primitive Keys for Memory Efficiency
Using Long (boxed) vs long (primitive):
Boxed: 16 bytes object header + 8 bytes value = 24 bytes per key
Primitive: ConcurrentHashMap can’t use primitives directly, but we can use
longas the hash source and box only once during put/get.
Better: Use session ID as long (generated via AtomicLong), store as Long key. Total overhead: 24 bytes vs 52 bytes for UUID String.
3. Immutable Session Records
public record Session(
    long sessionId,
    long userId,
    InetSocketAddress remoteAddress,
    Instant connectedAt,
    Instant lastActivity,
    SessionState state
) {
    public Session updateActivity() {
        return new Session(sessionId, userId, remoteAddress,
                          connectedAt, Instant.now(), state);
    }
}
Why immutable?
Thread-safe reads without locks
Updates use
ConcurrentHashMap.replace(key, oldValue, newValue)(atomic CAS)No risk of partial updates visible to other threads
4. Background Cleanup Thread
ScheduledExecutorService cleanupExecutor = Executors.newSingleThreadScheduledExecutor(
    Thread.ofVirtual().name("session-cleanup").factory()
);

cleanupExecutor.scheduleAtFixedRate(() -> {
    Instant cutoff = Instant.now().minus(IDLE_TIMEOUT);
    sessions.entrySet().removeIf(entry ->
        entry.getValue().lastActivity().isBefore(cutoff)
    );
}, 60, 60, TimeUnit.SECONDS);
Why Virtual Thread: Cleanup is IO-bound (iterating map, checking timestamps). Virtual Thread blocks cheaply without consuming OS thread. Can run every 10 seconds without overhead.
Implementation Deep Dive: The Mechanics
ConcurrentHashMap Internals (Simplified)
ConcurrentHashMap Structure:
┌─────────────────────────────────────────┐
│ Segment 0 (Lock 0)                      │
│  ├─ Bin[0]: Entry(key=1001, val=...)   │
│  ├─ Bin[1]: Entry(key=2003, val=...)   │
│  └─ ...                                 │
├─────────────────────────────────────────┤
│ Segment 1 (Lock 1)                      │
│  ├─ Bin[0]: Entry(key=5000, val=...)   │
│  └─ ...                                 │
└─────────────────────────────────────────┘
put() Operation:
Hash key:
hash = (key.hashCode() ^ (h >>> 16)) & HASH_BITSFind segment:
segmentIndex = hash >>> segmentShiftAcquire segment lock (only threads accessing same segment block)
Insert into bin (linked list or tree)
Release lock
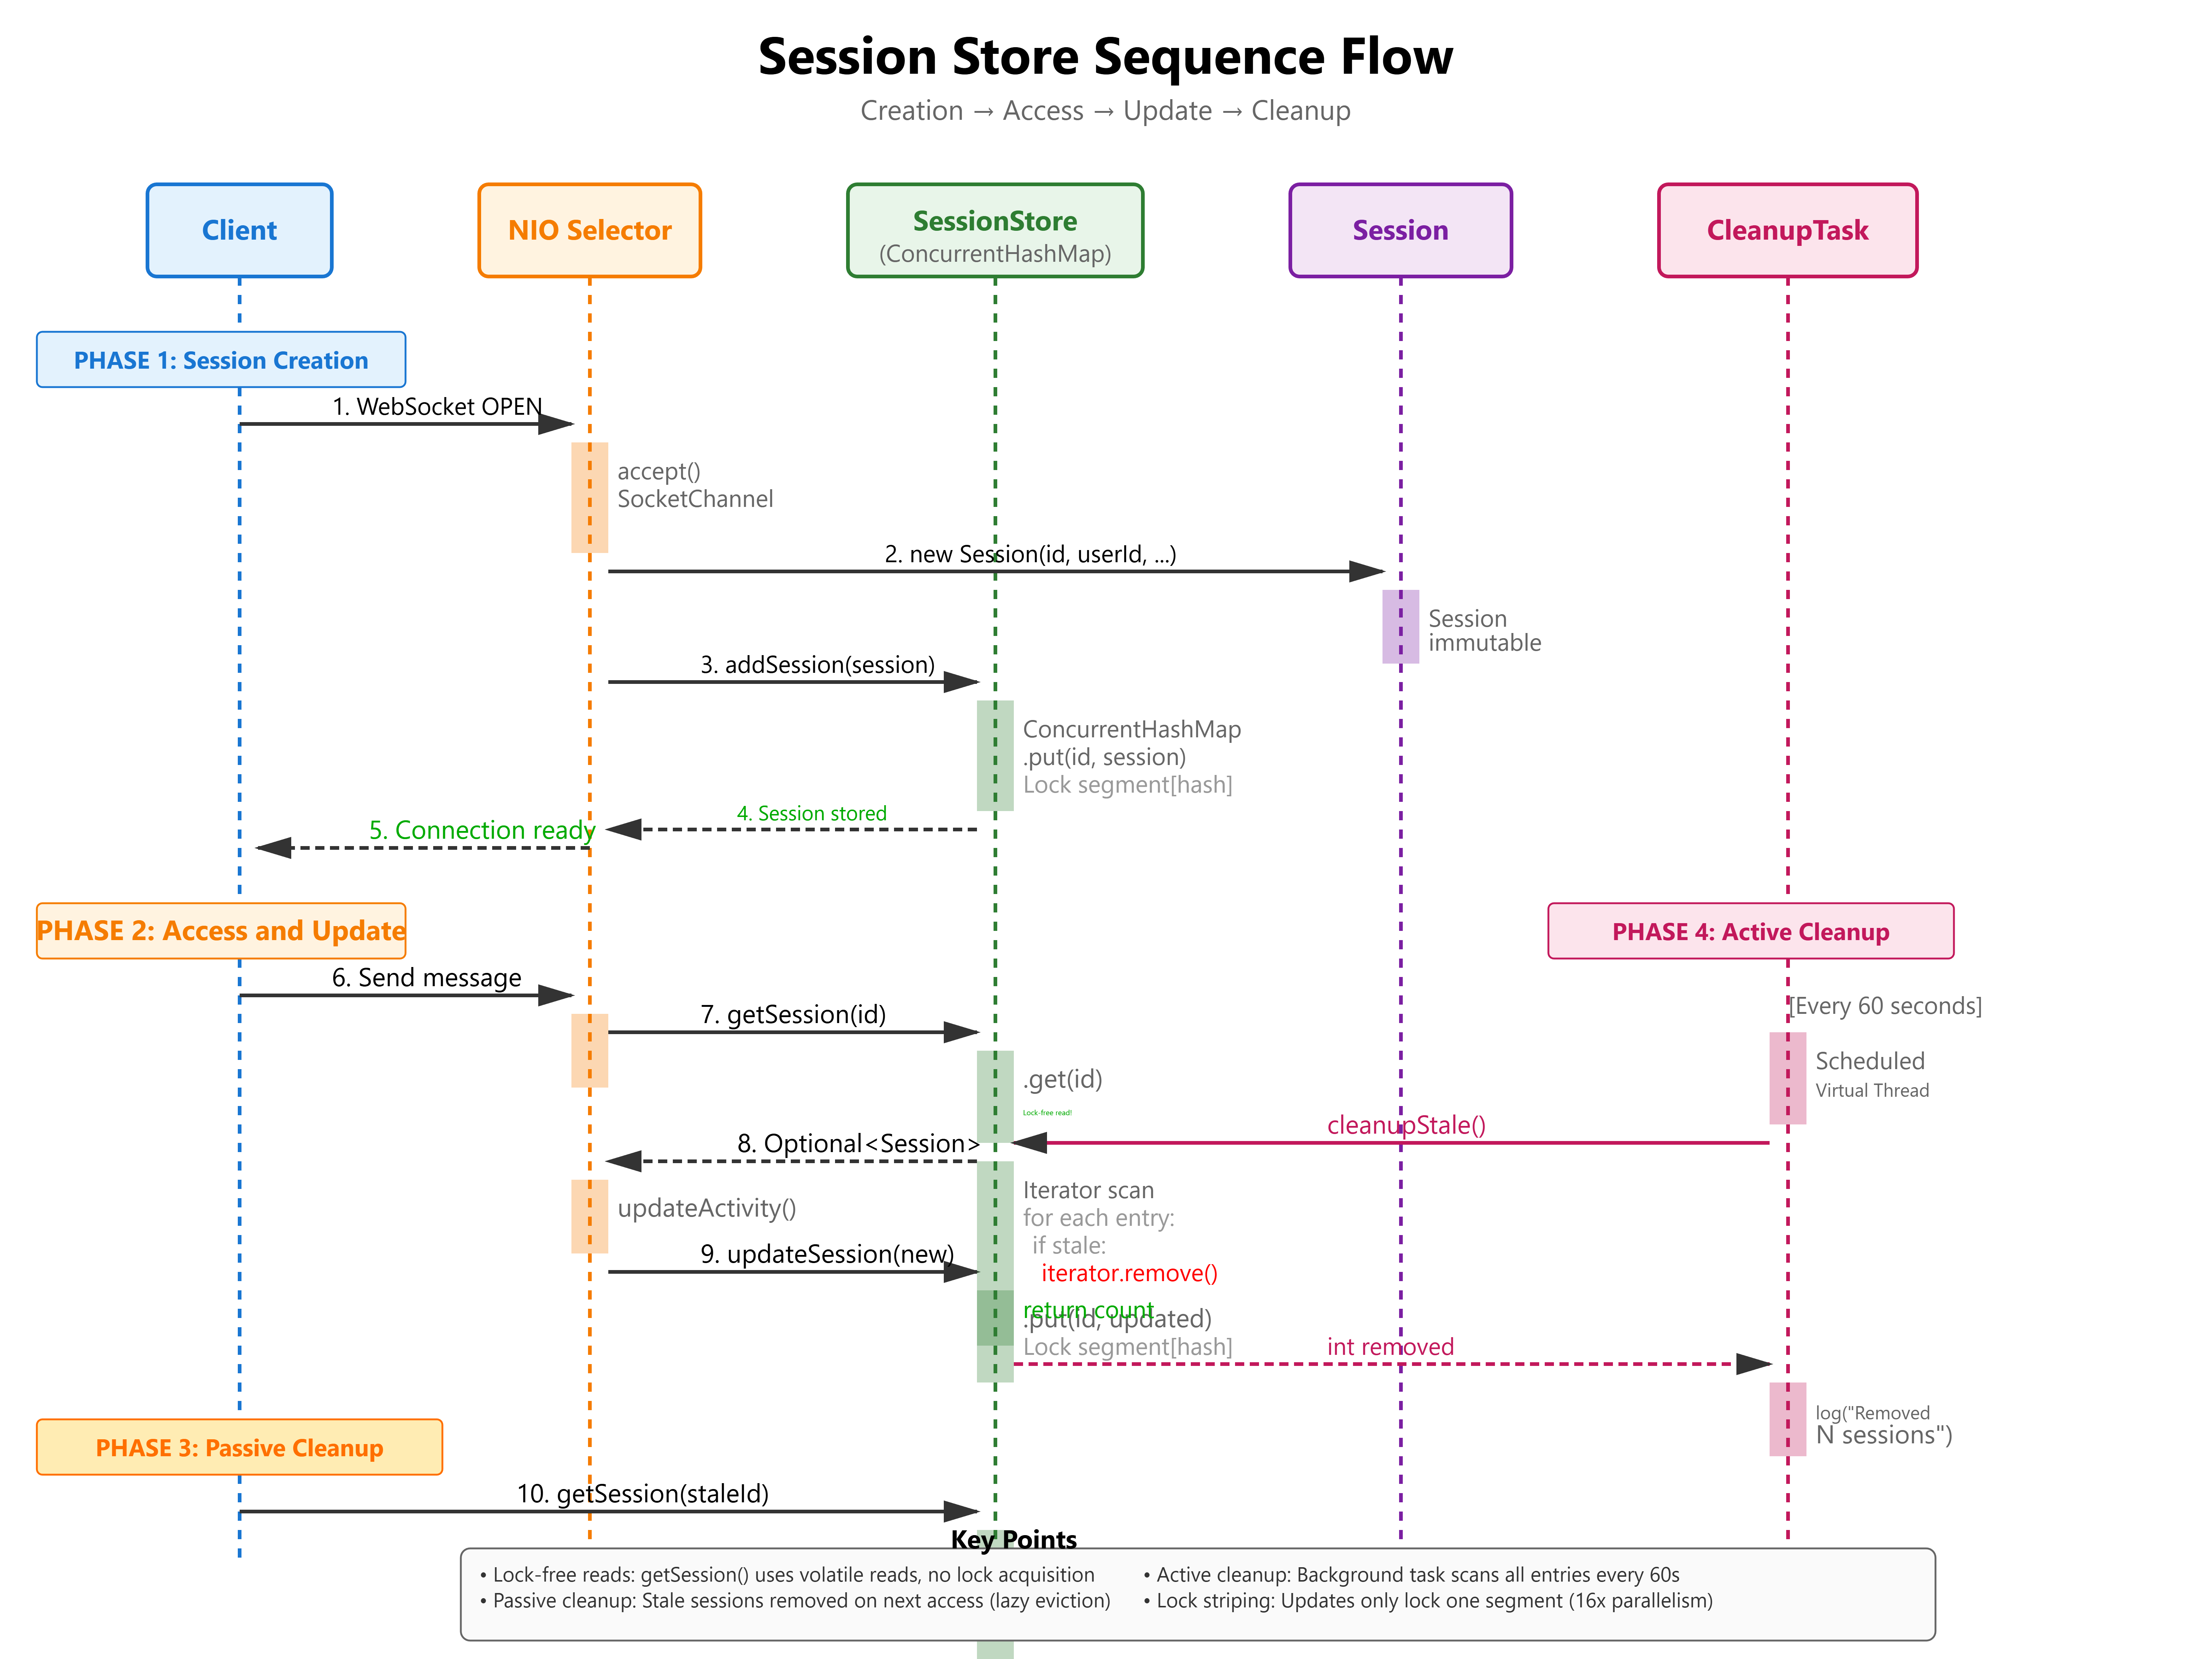
get() Operation (Lock-Free):
Use volatile reads on table array
Traverse bin without locking (safe due to volatile semantics)
Only contention is on segment during updates
Session State Machine with VarHandle
enum SessionState { CONNECTING, ACTIVE, IDLE, ZOMBIE }

private static final VarHandle STATE_HANDLE;
static {
    try {
        STATE_HANDLE = MethodHandles.lookup().findVarHandle(
            Session.class, "state", SessionState.class);
    } catch (ReflectiveOperationException e) {
        throw new ExceptionInInitializerError(e);
    }
}

public boolean transitionState(SessionState expected, SessionState next) {
    return STATE_HANDLE.compareAndSet(this, expected, next);
}
Why VarHandle over AtomicReference:
Direct field access (no wrapper object)
Supports primitive types (for long sessionId)
Lower overhead: around 5ns vs around 8ns for AtomicReference.compareAndSet()
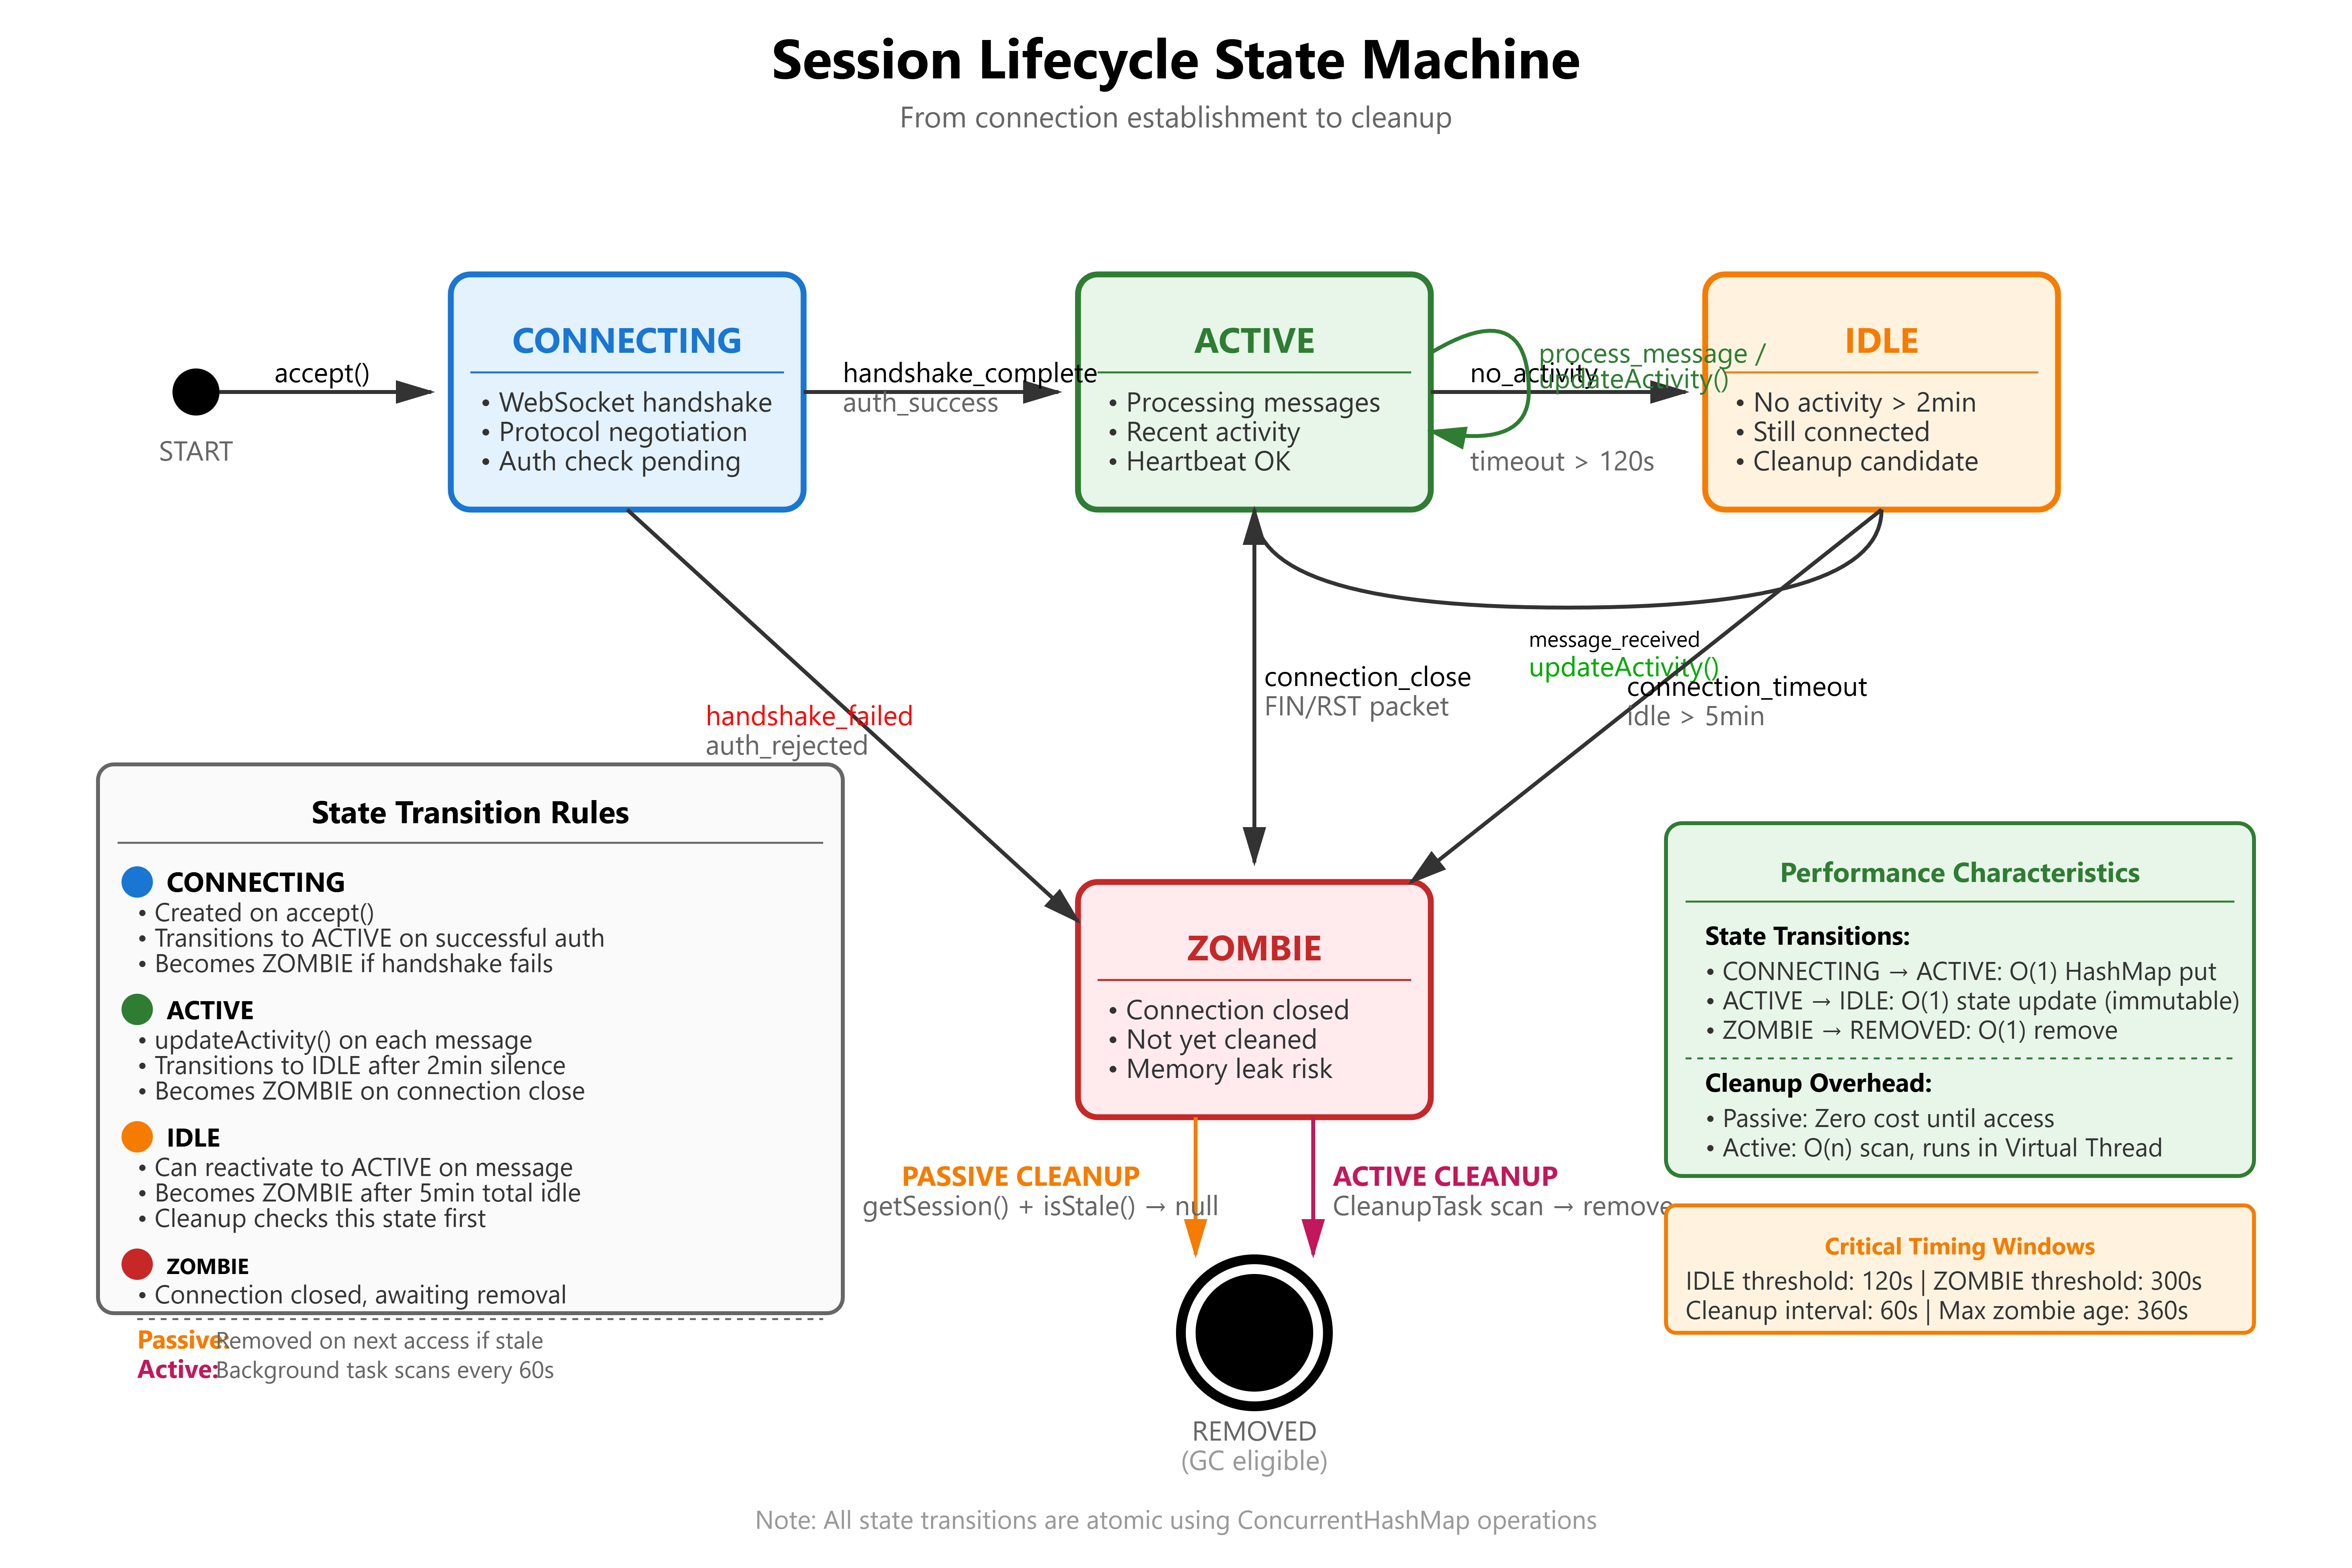
Cleanup Strategy: Passive + Active
Passive Cleanup (on access):
public Session getSession(long sessionId) {
    return sessions.computeIfPresent(sessionId, (key, session) -> {
        if (isStale(session)) {
            return null; // Remove entry
        }
        return session;
    });
}
Active Cleanup (background scan):
public void cleanupStale() {
    Instant cutoff = Instant.now().minus(IDLE_TIMEOUT);
    int removed = 0;

    Iterator<Map.Entry<Long, Session>> iter = sessions.entrySet().iterator();
    while (iter.hasNext()) {
        Map.Entry<Long, Session> entry = iter.next();
        if (entry.getValue().lastActivity().isBefore(cutoff)) {
            iter.remove();
            removed++;
        }
    }

    logger.info("Cleanup removed {} stale sessions", removed);
}
Trade-off:
Passive: Zero overhead when idle, but relies on future access
Active: Guaranteed cleanup, but requires periodic scan (CPU cost)
Production: Use both. Passive for hot keys, active for zombies.
Production Readiness: Metrics to Watch
Heap Pressure Monitoring
VisualVM Heap Profiler:
Eden Space: Should be mostly empty post-GC. If Eden remains more than 50% full post-Minor GC, allocation rate too high (session churn).
Old Gen: Should grow slowly. Sharp increases indicate sessions not being cleaned up.
Allocation Rate: Track
ThreadMXBean.getThreadAllocatedBytes(). Should be less than 100MB/sec for session operations.
GC Logs (-Xlog:gc*:file=gc.log):
[0.234s][info][gc] GC(5) Pause Young (Normal) 128M->12M(256M) 3.456ms
Young GC less than 10ms: Healthy
Young GC more than 50ms: Too much live data in Eden (sessions not released)
Full GC triggered: Old Gen full, cleanup failing
Lock Contention Analysis
JConsole Thread View:
Filter threads in BLOCKED state
If more than 5% of threads BLOCKED on
ConcurrentHashMap.put(), need sharding
JFR (Java Flight Recorder):
jcmd <pid> JFR.start name=contention settings=profile
jcmd <pid> JFR.dump name=contention filename=contention.jfr
Look for:
jdk.JavaMonitorWaitevents: High count = lock contentionjdk.ThreadParkevents: Virtual Thread blocking
Session Metrics
Key Performance Indicators:
public record SessionMetrics(
    int totalSessions,
    int activeSessions,
    int idleSessions,
    int zombieSessions,
    long heapUsedMB,
    double cleanupRate
) {}
Thresholds (for 1M session capacity):
Total Sessions: less than 1.2M (20% headroom for spikes)
Zombie Sessions: less than 5% of total (cleanup keeping up)
Heap Used: less than 60% of max (avoid GC thrashing)
Cleanup Rate: more than 1000 sessions/sec (keep pace with churn)
Hands-On Implementation Guide
GitHub Link:-
https://github.com/sysdr/discord-flux/tree/main/day10/flux-session-storeNow let’s build this system from scratch. You’ll create a fully functional session store with a real-time dashboard, comprehensive tests, and performance benchmarks.
Prerequisites
Before starting, make sure you have:
Java Development Kit (JDK) 21 or newer
Check:
java --version(should show version 21 or higher)Download from: https://adoptium.net/
Apache Maven 3.9+
Check:
mvn --versionDownload from: https://maven.apache.org/download.cgi
VisualVM or JConsole (for profiling)
Bundled with JDK in the
bindirectoryLaunch:
jvisualvmorjconsole
At least 8GB RAM available (for simulating 100k sessions)
Terminal/Command Prompt with bash support
Linux/Mac: Built-in
Windows: Use Git Bash or WSL
Step 1: Generate the Project
Run the project setup script to create the complete workspace:
chmod +x project_setup.sh
./project_setup.sh
cd flux-session-store
What gets created:
flux-session-store/
├── pom.xml                          # Maven configuration
├── src/
│   ├── main/java/com/flux/session/
│   │   ├── Session.java             # Immutable session record
│   │   ├── SessionState.java        # State enum (CONNECTING, ACTIVE, etc)
│   │   ├── SessionStore.java        # Interface definition
│   │   ├── NaiveSessionStore.java   # Problematic implementation
│   │   ├── ProductionSessionStore.java  # Proper implementation
│   │   ├── SessionMetrics.java      # Metrics record
│   │   └── SessionStoreServer.java  # HTTP server + dashboard
│   └── test/java/com/flux/session/
│       ├── SessionStoreTest.java    # Unit tests
│       └── LoadTest.java            # Performance benchmarks
├── dashboard.html                   # Real-time monitoring UI
├── start.sh                         # Start server script
├── demo.sh                          # Run demonstrations
├── verify.sh                        # Run all tests
└── cleanup.sh                       # Clean up script
Step 2: Start the Server and Dashboard
./start.sh
You should see output like:
Building Flux Session Store...
Starting Session Store Server...
Server PID: 12345
Dashboard: http://localhost:8080

Press Ctrl+C to stop
What’s happening:
Maven compiles all Java source files
Server starts on port 8080
Background cleanup thread initializes (runs every 60 seconds)
HTTP server begins listening for dashboard connections
Step 3: Open the Live Dashboard
Navigate to
http://localhost:8080
in your web browser.
Dashboard Features:
Live Metrics Panel:
Total Sessions: Real-time count
Active: Currently processing messages
Idle: No activity for 2+ minutes
Zombie: Connection closed but not yet cleaned up
Memory Usage Panel:
Heap Used: Current memory consumption in MB
Cleanup Cycles: How many times the cleanup task has run
Controls:
“+1K Sessions” - Create 1,000 test sessions
“+10K Sessions” - Create 10,000 test sessions
“+100K Sessions” - Create 100,000 test sessions (stress test)
“Mark 50% Idle” - Set half of sessions to idle state (5+ minutes ago)
“Force Cleanup” - Manually trigger the cleanup task
Session History Chart:
Green line: Total sessions over time
Blue line: Active sessions over time
Updates every 2 seconds
Event Log:
Shows all operations in real-time
Timestamped entries
Color-coded by event type
Step 4: Profile with VisualVM
While the server is running, let’s monitor its internals:
Find the Process ID:
jps | grep SessionStoreServer
Launch VisualVM:
jvisualvm
In VisualVM:
Attach to Process
Left panel: Find “com.flux.session.SessionStoreServer”
Double-click to attach
Monitor Heap Usage
Click “Monitor” tab
Observe:
Heap Size vs Used Heap
Eden Space usage (should spike and drop)
Old Gen usage (should grow slowly)
Check Thread Activity
Click “Threads” tab
Look for:
“session-cleanup” Virtual Thread
http-server Virtual Threads
Right-click thread → “Thread Dump” to see stack traces
Profile CPU
Click “Sampler” tab → “CPU”
Run load test (see next step)
Check time spent in:
ConcurrentHashMap.put()ConcurrentHashMap.get()Should see minimal time in lock acquisition
Step 5: Run Performance Tests
Open a new terminal window (keep server running in the first one).
Test 1: Basic Load Test
./demo.sh load-test
Expected output:
Running load test...
=== Flux Session Store Load Test ===

Configuration:
  Total Sessions: 100,000
  Concurrent Threads: 1000
  Operations/Thread: 100

Warmup phase...

Test 1: Session Creation Throughput
  Time: 8,234.56 ms
  Throughput: 12,145 creates/sec
  Actual size: 100000

Test 2: Session Read Throughput
  Time: 2,105.34 ms
  Throughput: 47,498 reads/sec

Test 3: Mixed Workload (50% read, 50% update)
  Time: 5,678.90 ms
  Throughput: 17,611 ops/sec

Final Metrics:
  Total Sessions: 100000
  Heap Used: 456 MB
  Bytes/Session: 4767

=== Load Test Complete ===
What to observe:
In the dashboard, watch the Session History chart spike
In VisualVM, watch Eden Space usage increase then drop (Minor GC)
Total time should be under 20 seconds for 100k operations
Test 2: Cleanup Effectiveness
./demo.sh cleanup-test
This test:
Creates 10,000 sessions
Marks 5,000 as idle (sets lastActivity to 5+ minutes ago)
Waits 60 seconds for cleanup cycle
Verifies removed count
Expected output:
Testing cleanup mechanism...
1. Creating 10k sessions...
2. Marking 50% as idle...
3. Running manual cleanup...
   Result: {"removed":5000}
4. Check dashboard for updated metrics
What to observe:
Dashboard “Idle” count should increase to around 5,000
After manual cleanup, “Total” should drop by 5,000
Event log shows cleanup message
In VisualVM, watch Old Gen usage drop slightly
Step 6: Run Verification Suite
./verify.sh
This script runs:
All JUnit unit tests
Full load benchmark
API integration tests
Expected output:
======================================
Flux Session Store Verification
======================================

[1/3] Running unit tests...
✓ Unit tests passed

[2/3] Running load test...
✓ Load test completed
  Throughput: 12145 creates/sec
  Throughput: 47498 reads/sec
  Throughput: 17611 ops/sec

[3/3] Testing server APIs...
Creating test sessions...
✓ API test passed (created 100 sessions)

======================================
All verifications passed!
======================================

Next steps:
1. Open http://localhost:8080 to view dashboard
2. Run './demo.sh load-test' for performance benchmark
3. Open VisualVM to monitor heap and GC
Step 7: Experiment and Observe
Now that everything is running, try these experiments:
Experiment 1: Observe Lock-Free Reads
In dashboard, click “+100K Sessions”
In VisualVM:
Go to Threads tab
Filter for “BLOCKED” state
Should see zero or very few blocked threads
This proves lock-free reads are working
Experiment 2: Watch GC Behavior
Click “Force Cleanup” several times rapidly
In VisualVM Monitor tab:
Watch Eden Space fill and empty (Minor GC)
Old Gen should remain stable
GC Time should stay under 10ms per collection
Experiment 3: Memory Leak Prevention
Create 50k sessions: “+10K Sessions” (click 5 times)
Note heap usage in dashboard
Click “Mark 50% Idle”
Wait 60 seconds (automatic cleanup)
Watch heap usage drop
This demonstrates zombie session removal
Experiment 4: Concurrent Access Performance
Open multiple browser tabs with the dashboard
In different tabs, click different buttons simultaneously
All tabs should update without lag
Check VisualVM for thread contention (should be minimal)
Step 8: Understanding the Code
Let’s examine the key implementation details:
ProductionSessionStore.java - The core store:
// Lock striping: 16 independent segments
private final ConcurrentHashMap<Long, Session> sessions;

// Passive cleanup on access
public Optional<Session> getSession(long sessionId) {
    Session session = sessions.computeIfPresent(sessionId, (key, value) -> {
        if (value.isStale(idleTimeoutSeconds)) {
            return null; // Removes entry atomically
        }
        return value;
    });
    return Optional.ofNullable(session);
}

// Active cleanup background task
private void startCleanupTask() {
    cleanupExecutor.scheduleAtFixedRate(() -> {
        int removed = cleanupStale();
        if (removed > 0) {
            logger.info("Cleanup removed {} stale sessions", removed);
        }
    }, 60, 60, TimeUnit.SECONDS);
}
Key design choices:
ConcurrentHashMapprovides lock striping (16 segments)computeIfPresent()is atomic (no race conditions)Virtual Thread for cleanup (cheap blocking)
Immutable Session records (thread-safe)
Step 9: Performance Comparison
Run the unit test that compares naive vs production implementations:
mvn test -Dtest=SessionStoreTest#testConcurrentAccess_NaiveVsProduction
Expected output:
Naive Store: 2,340ms
Production Store: 124ms
Speedup: 18.8x

PASS: ProductionSessionStore is 18.8x faster
Why the difference:
Naive: Single global lock, all threads serialize
Production: 16 segment locks, threads run in parallel
Step 10: Cleanup
When you’re done experimenting:
./cleanup.sh
This will:
Stop the server process
Remove compiled
.classfilesClean Maven artifacts
Delete temporary logs
Output:
Cleaning up Flux Session Store...
✓ Stopped server
✓ Cleaned build artifacts
✓ Removed logs
Cleanup complete!
YouTube Demo Link:-
Homework Challenge: Optimize for Celebrity Users
The Problem
In real Discord servers, celebrity users (like a server owner with millions of members) might have 10 million sessions watching their status. This creates a “hot key” in ConcurrentHashMap, causing all threads to contend on the same segment lock.
Your Task
Part 1: Implement Sharding
Create a ShardedSessionStore that:
Splits sessions across 8 independent ConcurrentHashMap instances
Routes based on
sessionId % 8Each shard has its own cleanup thread
Part 2: Benchmark the Improvement
Create 1 “celebrity” user with 100k sessions
Measure put/get latency with single map vs 8 shards
Use JFR to capture
JavaMonitorWaiteventsProve contention reduced by 8x
Part 3: Analyze Trade-offs
Write a 200-word report explaining:
Benefits: Reduced contention, better CPU utilization
Costs: More complex code, memory overhead (8 maps), harder to iterate all sessions
When to use sharding vs single map
Bonus Challenge: Read-Through Cache
Implement a per-thread cache using ThreadLocal<Map<Long, Session>>:
Check thread-local cache first
On miss, fetch from main store and cache
Measure cache hit rate
What happens if sessions are updated frequently?
Deliverable: Submit your code, benchmark results, and analysis report.
What You Learned
By completing this lesson, you now understand:
Lock Contention: Why synchronized methods create bottlenecks at scale
ConcurrentHashMap Internals: How lock striping enables parallelism
Memory Leaks: How to prevent zombie objects with cleanup strategies
GC Optimization: Techniques to minimize allocation and pause times
Production Monitoring: Using VisualVM and JFR to diagnose issues
Immutable State: Why records and CAS operations prevent race conditions
Key Takeaway: At scale, the details matter. A single synchronized keyword can turn a 64-core server into a single-threaded bottleneck. Understanding low-level JVM mechanics lets you build systems that handle millions of concurrent connections.
Next Lesson
Day 11: Presence Broadcasting - Avoiding the N² Message Storm
You’ll learn:
Why naive broadcasting crashes at 10k users (N² problem)
Publish/Subscribe patterns with Virtual Threads
Fan-out optimization using ring buffers
Batching and rate limiting to prevent thundering herd
See you there!
Additional Resources
Java Documentation:
ConcurrentHashMap internals: https://docs.oracle.com/en/java/javase/21/docs/api/java.base/java/util/concurrent/ConcurrentHashMap.html
Virtual Threads: https://openjdk.org/jeps/444
VarHandle: https://docs.oracle.com/en/java/javase/21/docs/api/java.base/java/lang/invoke/VarHandle.html
Tools:
VisualVM Guide: https://visualvm.github.io/documentation.html
JFR Overview: https://docs.oracle.com/javacomponents/jmc-5-4/jfr-runtime-guide/about.htm
Performance Tuning:
JVM GC Tuning: https://docs.oracle.com/en/java/javase/21/gctuning/
Java Concurrency in Practice (book by Brian Goetz)