

Day 26: The Dead Letter Queue Pattern
Where Failed Tasks Find Their Final Rest
The Problem That Keeps System Architects Awake
Picture this: you’ve built a robust task scheduler with sophisticated retry mechanisms. Tasks fail, get retried with exponential backoff, and mostly succeed on subsequent attempts. But what happens to those stubborn tasks that fail repeatedly? They can’t retry forever—that would consume resources indefinitely and potentially mask deeper system issues.
This is where the Dead Letter Queue (DLQ) pattern becomes your safety net. It’s not just about failure handling; it’s about creating observability into your system’s edge cases and maintaining operational sanity.
What Is a Dead Letter Queue?
A Dead Letter Queue is a specialized storage mechanism for messages or tasks that cannot be successfully processed after exhausting all retry attempts. Think of it as the “emergency room” for failed operations—a place where problematic tasks are quarantined for investigation and manual intervention.
Unlike regular task queues that are actively processed, DLQs are passive. They store failed tasks with rich metadata about what went wrong, how many times they were retried, and when they were moved to the DLQ. This transforms debugging from reactive firefighting into proactive system health monitoring.
Why DLQs Are Critical in Production Systems
Preventing Resource Exhaustion: Without DLQs, failed tasks could retry indefinitely, consuming CPU, memory, and database connections. DLQs act as a circuit breaker for the retry mechanism itself.
Operational Visibility: DLQs provide a window into system health. A sudden spike in DLQ entries might indicate an upstream service degradation, network issues, or data corruption. This early warning system is invaluable for maintaining high availability.
Compliance and Audit Requirements: In financial or healthcare systems, you cannot simply drop failed transactions. DLQs ensure complete auditability—every failed operation is preserved with sufficient context for investigation and potential reprocessing.
Graceful Degradation: Rather than crashing or blocking the entire system when encountering problematic data, DLQs enable graceful degradation. The system continues processing healthy tasks while isolating problematic ones.
Real-World Context: How Netflix Uses DLQs
Netflix processes billions of events daily across their streaming platform. When a user interaction fails to process (like updating a watchlist), it doesn’t just disappear. Their DLQ system categorizes failures by type—temporary network glitches go to one DLQ for automatic reprocessing, while data corruption issues go to another for manual investigation.
This approach allows Netflix to maintain their famous “9s” of availability while ensuring no user action is permanently lost. During their famous 2011 AWS outage, DLQs helped them identify and reprocess millions of failed operations once services recovered.
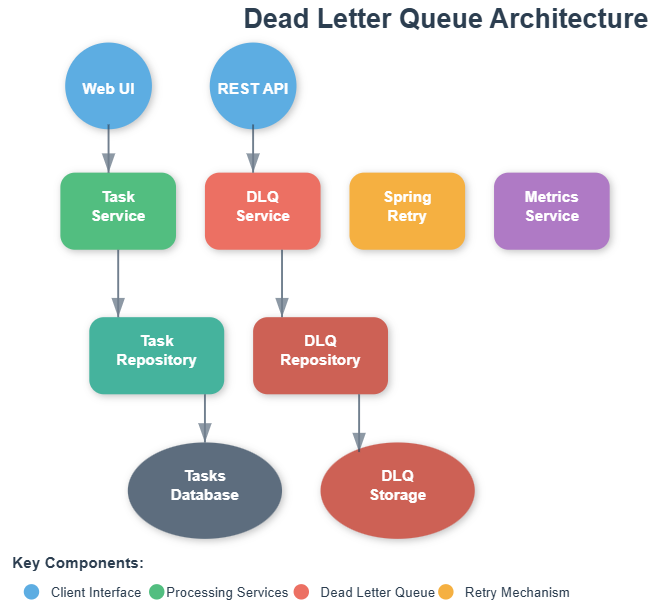
Architecture Integration
In our task scheduler system, the DLQ sits at the intersection of multiple components:
Task Executor: When a task exceeds its maximum retry count, the executor moves it to the DLQ instead of dropping it.
Monitoring Dashboard: DLQ entries feed directly into alerts and metrics, providing real-time visibility into system health.
Admin Interface: Operations teams can view, analyze, and manually reprocess tasks from the DLQ.
Analytics Pipeline: DLQ data provides insights into failure patterns, helping identify systemic issues and optimization opportunities.
Implementation Strategies
Database Table Approach: Store failed tasks in a dedicated dead_letter_tasks table with columns for original task data, failure reason, retry count, and timestamps. This provides ACID guarantees and complex querying capabilities.
Message Broker Topic: Use a dedicated Kafka topic or RabbitMQ queue for failed tasks. This approach scales better and integrates naturally with event-driven architectures.
Hybrid Approach: Critical tasks go to a database table for guaranteed persistence, while high-volume, less critical tasks use a message broker for better performance.
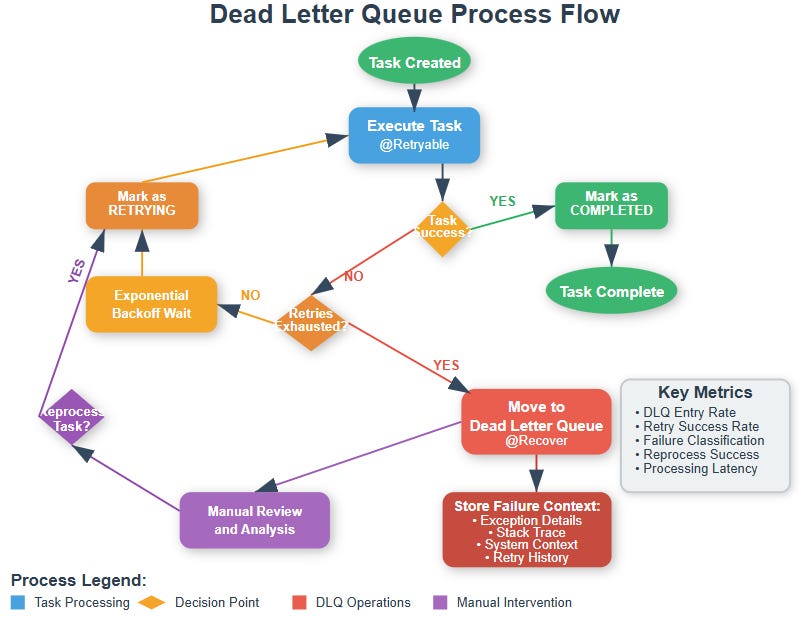
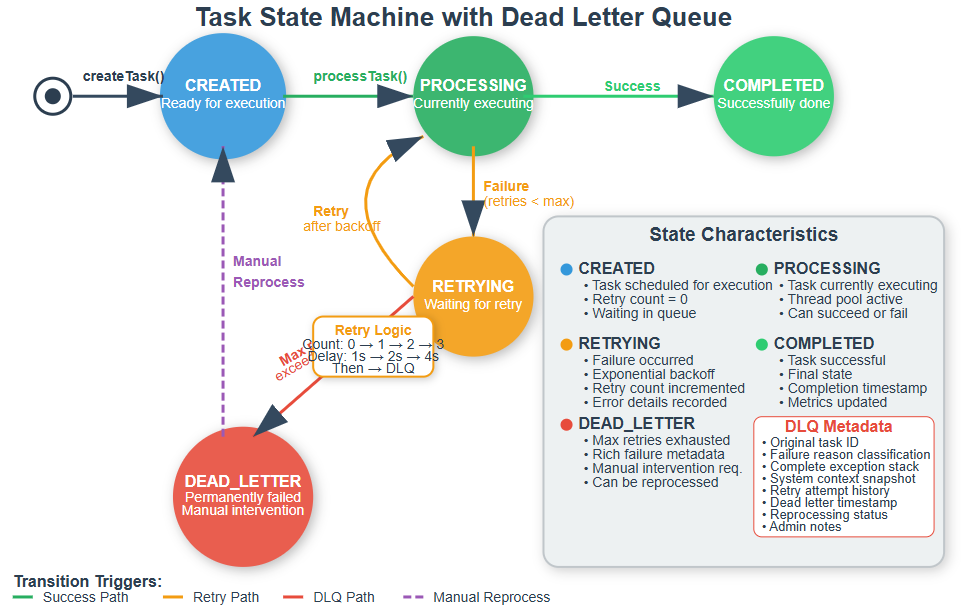
State Transitions and Data Flow
Tasks flow through distinct states: CREATED → PROCESSING → RETRYING → DEAD_LETTER or COMPLETED. The DLQ represents the terminal state for permanently failed tasks, but crucially, it’s not truly terminal—tasks can be manually moved back to CREATED for reprocessing after fixing underlying issues.
The data enrichment in the DLQ is crucial. Beyond the original task payload, we store:
Complete exception stack traces
Retry attempt history with timestamps
System context (CPU usage, memory pressure)
Related task correlation IDs for investigating cascading failures
Key Design Decisions
Retention Policy: How long should DLQ entries be retained? Too short and you lose debugging context; too long and storage costs spiral. A common pattern is 30-day retention with automatic archival to cheaper storage.
Reprocessing Strategy: Should DLQ items be automatically retried after a cool-down period, or require manual intervention? The answer depends on your failure patterns and operational capacity.
Monitoring Integration: DLQ metrics should integrate with your alerting system. High DLQ rates might indicate systemic issues requiring immediate attention.
Building Your DLQ Implementation
Github Link :
https://github.com/sysdr/taskscheduler/tree/main/day26/task-scheduler-dlqNow let’s build a complete working system that demonstrates the DLQ pattern in action.
Prerequisites
Before you start, make sure you have:
Java 21 installed (download from adoptium.net)
Maven 3.9 or higher for dependency management
Your favorite IDE (IntelliJ IDEA, Eclipse, or VS Code)
Basic understanding of Spring Boot from previous lessons
Verify your setup:
java -version
mvn -version
Phase 1: Project Foundation
The complete project setup script creates a standard Maven project with Spring Boot. Run the provided script to generate the entire project structure with all necessary files.
The key components include:
Data Models:
Task.java- Core task entity with status trackingDeadLetterTask.java- Rich failure context storageTaskStatusenum - State definitions (CREATED, PROCESSING, RETRYING, COMPLETED, DEAD_LETTER)FailureReasonenum - Failure classification (TIMEOUT, NETWORK_ERROR, VALIDATION_ERROR, etc.)
Services:
TaskService.java- Task processing with Spring Retry integrationDeadLetterService.java- DLQ operations and reprocessing logic
Controllers:
TaskController.java- REST API for task managementDeadLetterController.java- DLQ query and reprocess endpointsDashboardController.java- Web UI for monitoring
Phase 2: Understanding the Core Components
DeadLetterService is the heart of the DLQ pattern. When a task exhausts its retry attempts, this service:
Extracts complete failure information including stack traces
Classifies the failure type (timeout, network, validation, etc.)
Captures system state at the time of failure
Saves everything to the DLQ repository
Updates the original task status to DEAD_LETTER
Increments metrics for monitoring
The moveToDeadLetter method is called automatically by Spring Retry’s recovery mechanism when all retry attempts are exhausted.
TaskService integrates Spring Retry with custom recovery:
@Retryable(
    retryFor = {TaskProcessingException.class},
    maxAttemptsExpression = “#{@task.maxRetries + 1}”,
    backoff = @Backoff(delayExpression = “#{1000}”, multiplierExpression = “#{2}”)
)
public void processTask(Task task) throws TaskProcessingException {
    // Task processing logic
}

@Recover
public void recoverFromFailure(TaskProcessingException ex, Task task) {
    deadLetterService.moveToDeadLetter(task, ex);
}
The @Recover annotation tells Spring Retry what to do when all retry attempts fail.
Phase 3: Building and Running
Navigate to your project directory and build:
./build.sh
This script will:
Clean any previous builds
Compile the source code
Run unit tests
Package everything into an executable JAR
Start the application:
./start.sh
The application will start and display:
Dashboard URL: http://localhost:8080
DLQ Monitor: http://localhost:8080/dlq
Database Console: http://localhost:8080/h2-console
Metrics Endpoint: http://localhost:8080/actuator/metrics
Phase 4: Demonstrating the DLQ Pattern
Run the demo script to see everything in action:
./demo.sh
This creates six different types of tasks:
email-success - Processes successfully
email-timeout - Simulates timeout errors
data-validation - Triggers validation failures
network-fail - Simulates network connectivity issues
random-fail - Has a 70% chance of failing
process-success - Another success case with delayed scheduling
Watch the dashboard as tasks move through different states. Failed tasks will retry with exponential backoff (1 second, 2 seconds, 4 seconds) before moving to the DLQ.
Phase 5: Exploring the Dashboards
Main Dashboard shows real-time statistics:
Total tasks across all states
Color-coded status cards for quick health checks
Recent task activity with status indicators
Auto-refresh every 5 seconds for live monitoring
DLQ Management Interface provides:
Paginated list of all failed tasks
Detailed failure information including stack traces
One-click reprocessing capability
Failure reason statistics for pattern analysis
Click on any DLQ entry to see complete failure details including the exact exception, retry history, and system state at failure time.
Phase 6: Testing the Reprocess Feature
In the DLQ dashboard, select a failed task and click “Reprocess”. This:
Creates a brand new task with the same payload
Resets the retry counter to zero
Marks the DLQ entry as reprocessed with timestamp
Maintains a complete audit trail
The new task goes through the normal processing flow. If the underlying issue was temporary (like a network glitch), it will now succeed.
Phase 7: Verification
Run the verification script to confirm everything works:
./verify.sh
This checks:
Application health endpoint responds correctly
All REST APIs are functional
Task creation works properly
DLQ operations are accessible
Web interfaces load successfully
Understanding the Database Schema
Open the H2 console at http://localhost:8080/h2-console:
JDBC URL: jdbc:h2:mem:testdb
Username: sa
Password: (leave empty)
Examine the tasks table to see task states and retry counts. The dead_letter_tasks table contains rich failure metadata. Notice how each DLQ entry includes:
Original task reference
Complete exception details
System context snapshot
Timestamp information
Reprocessing status
Monitoring and Metrics
Access Prometheus-compatible metrics at http://localhost:8080/actuator/metrics. Key metrics to watch:
tasks.created- Total tasks createdtasks.completed- Successfully completed taskstasks.failed- Failed task attemptstasks.dead_lettered- Tasks moved to DLQdlq.tasks.created- DLQ entries by failure reasondlq.tasks.reprocessed- Successfully reprocessed tasks
These metrics help you understand system health and identify patterns in failures.
Common Failure Patterns
As you run the demo, you’ll notice:
Timeout Failures - Tasks with “timeout” in the name consistently fail with timeout exceptions. These represent external service delays.
Validation Errors - Tasks with invalid data fail immediately without retries being helpful. These indicate data quality issues upstream.
Network Failures - Transient connectivity issues that might succeed on retry, but eventually exhaust attempts if persistent.
Random Failures - Simulate intermittent issues that sometimes succeed on retry, demonstrating why retry logic is essential.
Stopping the Application
When you’re done exploring:
./stop.sh
This gracefully shuts down the application, ensuring all tasks complete their current processing.
Assignment: Enhance the DLQ System
Create these improvements to deepen your understanding:
Failure Categorization Dashboard: Build a pie chart showing distribution of failure reasons in the DLQ. This helps identify systemic issues.
Automatic Reprocessing: Implement a scheduled job that automatically retries DLQ tasks after a cooling-off period (e.g., 1 hour). Some failures are temporary and resolve themselves.
Alert Thresholds: Add email alerts when DLQ entry rate exceeds a threshold (e.g., more than 10 failures in 5 minutes). This enables proactive incident response.
Batch Reprocessing: Allow operations teams to select multiple DLQ entries and reprocess them together, useful after fixing a systemic issue.
Failure Pattern Analysis: Track which task types fail most frequently and generate recommendations for system improvements.
Solution Hints
For the failure categorization dashboard, use the getFailureReasonStats() method in DeadLetterService. This returns a map of failure reasons to counts, perfect for visualization.
For automatic reprocessing, create a scheduled job using @Scheduled(cron = “0 0 * * * *”) that queries DLQ entries older than 1 hour and calls reprocessTask() for each.
For alerts, integrate with Spring Boot’s metrics system and configure alert rules based on counter values. The meterRegistry already tracks DLQ creation rates.
Remember: a well-designed DLQ system transforms mysterious failures into actionable insights. It’s the difference between reactive debugging and proactive system health management.
Key Takeaways
You’ve now built a production-ready Dead Letter Queue system that:
Automatically captures failed tasks after retry exhaustion
Stores rich failure context for debugging
Provides operational dashboards for monitoring
Enables manual intervention and reprocessing
Integrates seamlessly with Spring Retry
Exports metrics for alerting and analysis
The DLQ pattern is essential for building resilient distributed systems. It ensures no task is silently lost, provides visibility into failure patterns, and gives operations teams the tools they need to maintain system health.
In the next lesson, we’ll add Circuit Breaker pattern with Resilience4j to protect our system from cascading failures when external services become unreliable. The combination of DLQ and Circuit Breaker creates a robust defense against both transient and persistent failures.
Success Criteria
You’ve mastered this lesson when you can:
Explain why DLQs are necessary in distributed systems
Identify when a task should move to the DLQ versus continuing retries
Navigate the DLQ dashboard and understand failure classifications
Reprocess failed tasks after investigating root causes
Monitor DLQ metrics to detect systemic issues
Extend the basic implementation with custom failure handlers
Working Code Demo:
Your implementation should cleanly handle task failures, provide rich debugging information, and offer both automated and manual recovery paths. When you can confidently say “I know why every task failed and can easily fix it,” you’ve mastered the DLQ pattern.