

Day 3: Understanding ThreadPoolTaskScheduler and TaskExecutor - The Engine Behind Your Scheduled Tasks
What We'll Build Today
In this hands-on lesson, you'll create a complete thread pool monitoring system that includes:
Custom ThreadPoolTaskScheduler Configuration - Optimize thread pools for better performance
Multiple Scheduled Tasks - Six different tasks with various timing patterns (fixed-rate, cron, delays)
Real-time Monitoring Dashboard - Live visualization of thread pool metrics and task execution
Performance Metrics Collection - Track execution times, thread utilization, and queue depth
Production-Ready Features - Actuator endpoints, Docker deployment, graceful shutdown
The Story Behind the Threads
Picture this: You're running a busy restaurant kitchen. Yesterday (Day 2), we learned how to schedule different cooking tasks using @Scheduled - like preparing appetizers every 5 minutes, checking main dishes every 30 seconds, and cleaning counters at midnight. But here's the thing - who's actually doing this work?
In Spring Boot's scheduling world, @Scheduled is just the "recipe book" that tells us WHAT to do and WHEN. But the actual "chefs" doing the work are threads managed by something called ThreadPoolTaskScheduler. Today, we're going behind the scenes to understand how Spring Boot manages these worker threads and how we can optimize them for better performance.
Why This Matters in Real Systems
Companies like Netflix process millions of scheduled tasks daily - from updating user recommendations to cleaning up temporary files. Reddit schedules hundreds of thousands of comment processing tasks. Discord handles millions of message cleanup operations. The difference between a system that handles 100 users versus 100,000 users often comes down to how well you manage your thread pools.
Core Concepts: The Threading Architecture
→ Subscribe now to access source code repository - 200 + coding lessons
ThreadPoolTaskScheduler vs TaskExecutor
Think of these as two different types of workforce management:
ThreadPoolTaskScheduler: Your specialized timing crew
Handles scheduled tasks with precise timing
Manages recurring operations (cron, fixed-rate, fixed-delay)
Built specifically for time-based task execution
Includes scheduling capabilities beyond just execution
TaskExecutor: Your general-purpose workforce
Handles asynchronous task execution
Focuses on "do this work now" rather than "do this work at a specific time"
Often used for @Async methods
Pure execution without scheduling logic
The Default Behavior (Why It's Not Enough)
By default, Spring Boot uses a single-threaded scheduler. Imagine our restaurant kitchen with only one chef - no matter how many dishes you schedule, they all wait in line. This creates a bottleneck that becomes critical as your application scales.
Architecture: How It Fits in Our Ultra-Scalable System
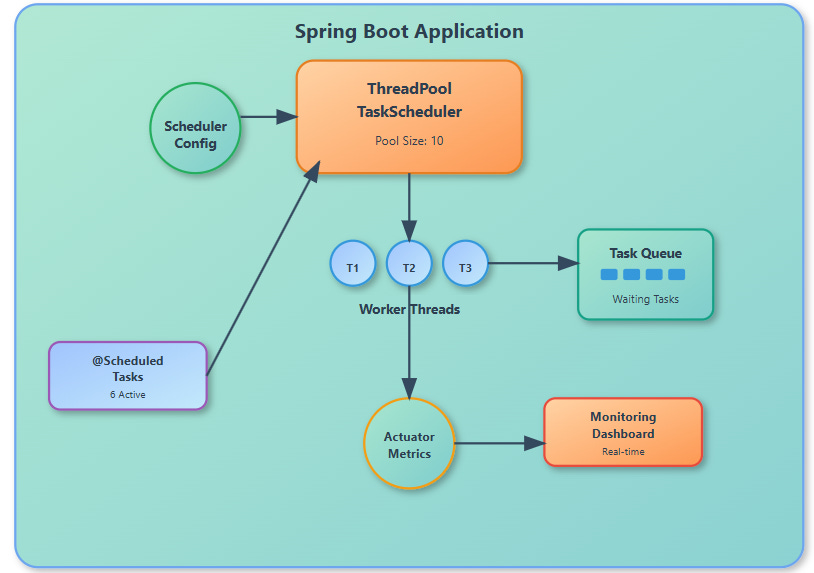
In our larger task scheduler implementation, thread pool management sits at the core:
[Client Requests]
    ↓
[API Gateway]
    ↓
[Task Scheduler Service] ← ThreadPoolTaskScheduler manages execution
    ↓
[Message Queue] ← Tasks get queued for processing
    ↓
[Worker Nodes] ← Each node has optimized thread pools
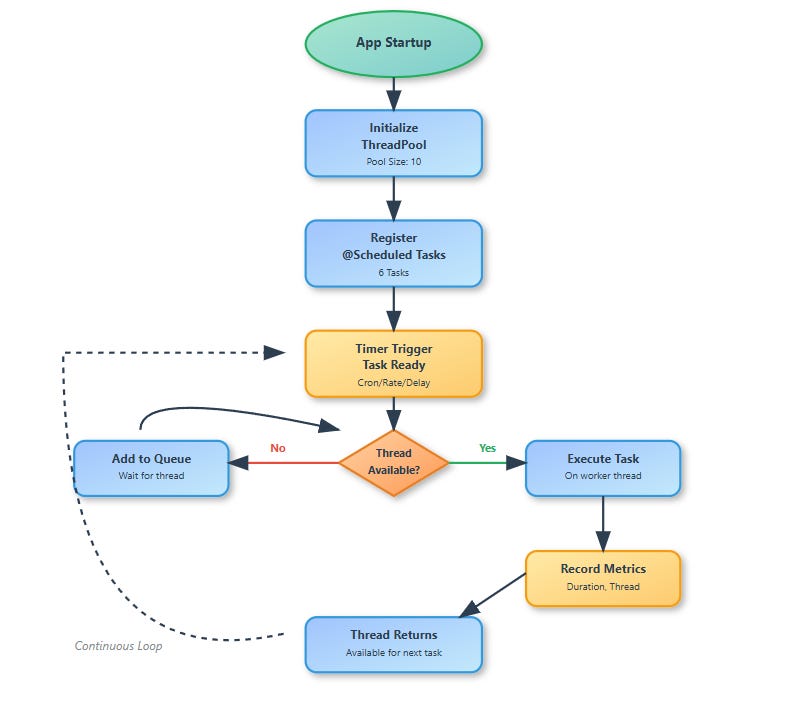
Control Flow: From Schedule to Execution
Task Registration: Your @Scheduled method registers with the TaskScheduler
Thread Assignment: TaskScheduler assigns execution to available threads
Execution: Worker thread executes your task
Completion: Thread returns to pool for next task
Monitoring: Spring tracks execution metrics
System Design Concepts Used
Concurrency Management
Thread Pool Pattern: Reusing threads instead of creating new ones
Work Queue: Tasks wait in queue when all threads are busy
Resource Optimization: Limiting memory usage through bounded pools
Performance Optimization
Pool Sizing: Balancing between responsiveness and resource usage
Thread Lifecycle Management: Efficient creation, reuse, and cleanup
Load Distribution: Spreading work across available threads
Real-Time Production Application
Consider a e-commerce platform handling:
Order processing: Every 10 seconds
Inventory updates: Every 30 seconds
Email campaigns: Every hour
Database cleanup: Daily at 2 AM
Without proper thread management, one slow database cleanup could delay urgent order processing. With optimized thread pools, each type of task gets appropriate resources.
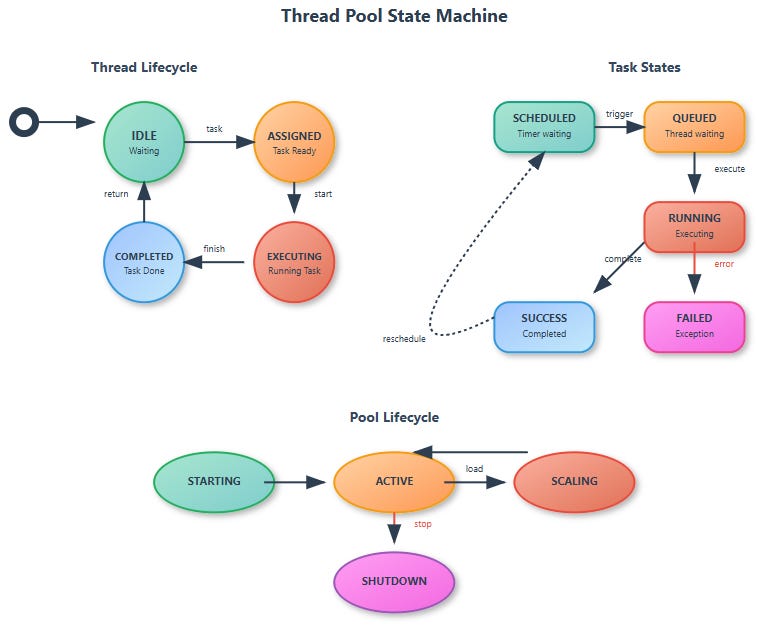
State Changes in Thread Pool Management
Thread States:
IDLE → ASSIGNED → EXECUTING → COMPLETED → IDLE

Pool States:
STARTING → ACTIVE → SCALING → SHUTTING_DOWN → TERMINATED
Component Architecture
Our ThreadPoolTaskScheduler configuration affects three key areas:
Core Pool Size: Minimum number of active threads
Max Pool Size: Maximum threads under load
Queue Capacity: How many tasks can wait
Data Flow
Scheduled Task Request → Task Queue → Available Thread → Task Execution → Result/Logging
Key Configuration Parameters
Pool Sizing Strategy
Core Pool Size: Start with CPU cores × 2 for I/O-bound tasks
Max Pool Size: Usually 2-4x core pool size
Keep Alive Time: How long idle threads stay alive
Queue Capacity: Buffer for task bursts
Real-World Sizing Examples
Small API (1-10 users): Core=2, Max=4, Queue=10
Medium Service (100-1000 users): Core=8, Max=16, Queue=50
Large Platform (10,000+ users): Core=20, Max=50, Queue=200
Building Your Thread Pool Monitor
Github Link :
https://github.com/sysdr/taskscheduler-p/tree/main/day3/thread-pool-scheduler
Prerequisites Setup
Before we start coding, make sure you have:
Java 21 installed and working
Maven 3.6+ for building our project
IDE like IntelliJ IDEA or VS Code
Docker (optional) for the complete monitoring stack
Verify everything works:
java -version    # Should show Java 21
mvn -version     # Should show Maven 3.6+
Step 1: Project Foundation
Create a new Spring Boot project with these dependencies:
Spring Boot Web
Spring Boot Actuator (for monitoring)
Thymeleaf (for our dashboard)
Micrometer (for custom metrics)
Your pom.xml should include these key dependencies:
<dependency>
    <groupId>org.springframework.boot</groupId>
    <artifactId>spring-boot-starter-web</artifactId>
</dependency>
<dependency>
    <groupId>org.springframework.boot</groupId>
    <artifactId>spring-boot-starter-actuator</artifactId>
</dependency>
Step 2: Configure Your Custom Thread Pool
Create a configuration class that replaces Spring's default single-threaded scheduler:
@Configuration
@EnableScheduling
public class SchedulerConfig {

    @Bean(name = "customTaskScheduler")
    @Primary
    public ThreadPoolTaskScheduler customTaskScheduler() {
        ThreadPoolTaskScheduler scheduler = new ThreadPoolTaskScheduler();
        scheduler.setPoolSize(10);  // 10 worker threads
        scheduler.setThreadNamePrefix("custom-scheduler-");
        scheduler.setWaitForTasksToCompleteOnShutdown(true);
        scheduler.setAwaitTerminationSeconds(20);
        return scheduler;
    }
}
Key Configuration Choices:
Pool Size: 10 - Good starting point for development
Thread Name Prefix - Makes debugging easier
Graceful Shutdown - Waits for tasks to finish when app stops
Step 3: Create Multiple Scheduled Tasks
Build a service with different types of scheduled tasks to see how threads are distributed:
@Service
public class ScheduledTasksService {

    @Scheduled(fixedRate = 2000) // Every 2 seconds
    public void quickTask() {
        executeTask("quickTask", 100, 300);
    }

    @Scheduled(fixedRate = 5000) // Every 5 seconds
    public void mediumTask() {
        executeTask("mediumTask", 500, 1000);
    }

    @Scheduled(cron = "0/15 * * * * *") // Every 15 seconds
    public void cronTask() {
        executeTask("cronTask", 200, 800);
    }

    // Add more tasks with different patterns...
}
Each task simulates real work with random execution times, so you can observe how threads handle different workloads.
Step 4: Build the Monitoring Dashboard
Create a REST controller that serves both your web dashboard and API endpoints:
@Controller
public class MonitoringController {

    @GetMapping("/")
    public String dashboard(Model model) {
        model.addAttribute("threadPoolStats", monitoringService.getThreadPoolStats());
        model.addAttribute("taskMetrics", scheduledTasksService.getMetrics());
        return "dashboard";
    }

    @GetMapping("/api/thread-pool-stats")
    @ResponseBody
    public ResponseEntity<ThreadPoolStats> getThreadPoolStats() {
        return ResponseEntity.ok(monitoringService.getThreadPoolStats());
    }
}
Step 5: Real-Time Metrics Collection
Integrate with Spring Boot Actuator and Micrometer to collect and expose metrics:
@Service
public class MonitoringService {

    @PostConstruct
    public void setupMetrics() {
        Gauge.builder("thread.pool.active.threads")
             .description("Number of active threads in the pool")
             .register(meterRegistry, this, MonitoringService::getActiveThreads);
    }
}
Step 6: Create the Interactive Web Dashboard
Build an HTML template with real-time charts that update every 2 seconds:
Thread utilization pie chart - Shows active vs idle threads
Task execution timeline - Displays thread usage over time
Individual task performance cards - Metrics for each scheduled task
Performance insights - Tips for optimization
The dashboard uses Chart.js for visualizations and JavaScript polling for live updates.
Building and Testing
Local Development
# Build the project
mvn clean package

# Run tests
mvn test

# Start the application
./start.sh
Docker Deployment (Optional)
# Start with full monitoring stack
./start.sh docker
This includes Prometheus for metrics collection and Grafana for advanced dashboards.
Verification and Testing
Once your application is running:
Open the Dashboard - Navigate to http://localhost:8080
Watch Real-Time Updates - Metrics refresh every 2 seconds
Observe Thread Distribution - Multiple tasks running simultaneously
Check Actuator Endpoints - Visit
/actuator/metricsfor raw data
Success Indicators
Multiple tasks executing concurrently (not queued)
Thread pool utilization above 20%
No blocked task executions
Smooth dashboard updates
Performance Comparison
Before: All tasks execute sequentially on single thread
After: Tasks distribute across 10 worker threads
Result: Significantly better throughput and responsiveness
Key Monitoring Metrics
Track these critical measurements:
Active Threads: Currently executing tasks
Pool Size: Total available threads
Queue Size: Tasks waiting for threads
Task Execution Times: Performance per task type
Thread Utilization: Efficiency of your pool
Assignment: Thread Pool Performance Lab
Your Challenge: Create a Spring Boot application demonstrating the performance difference between default single-threaded scheduling and optimized thread pools.
Detailed Steps:
Implement both default and custom ThreadPoolTaskScheduler configurations
Create multiple scheduled tasks with different execution patterns
Build monitoring dashboard with real-time metrics
Load test with at least 10 concurrent scheduled tasks
Compare and document performance improvements
Success Criteria:
Measurable performance improvement with custom thread pool
Thread pool utilization metrics displayed
Handle concurrent tasks without blocking
Solution Hints
Configuration Strategy:
Start with pool size = CPU cores × 2
Monitor queue size to prevent backlog
Use appropriate rejection policies
Testing Approach:
Create tasks with varying execution times
Simulate real-world load patterns
Measure before/after performance metrics
Monitoring Best Practices:
Set up alerts for thread pool exhaustion
Track task execution latencies
Monitor error rates and exceptions
Production Readiness Checklist
[ ] Thread pool sized for expected load
[ ] Graceful shutdown configuration
[ ] Monitoring and alerting setup
[ ] Circuit breaker for external dependencies
[ ] Proper exception handling in tasks