Day 32: Wide-Column Basics - Setting Up Local ScyllaDB/Cassandra
Introduction
Have you ever wondered how Discord handles billions of messages without slowing down? Or how Instagram stores your photos so they load instantly? The secret isn’t just throwing more servers at the problem. It’s about choosing the right type of database for the job.
Today, we’re going to learn about a completely different approach to storing data: Wide-Column Stores. These databases power some of the biggest applications in the world, and by the end of this lesson, you’ll understand why.
The PostgreSQL Trap
Let’s start with a story that happens all the time in the real world.
A junior engineer is building a chat system. They’re smart and use what they learned in school: PostgreSQL. They create a simple table to store messages:
CREATE TABLE messages (
    id BIGSERIAL PRIMARY KEY,
    channel_id BIGINT NOT NULL,
    user_id BIGINT NOT NULL,
    content TEXT,
    created_at TIMESTAMP DEFAULT NOW()
);
CREATE INDEX idx_channel_messages ON messages(channel_id, created_at DESC);
This design works beautifully during testing. With 1,000 messages, queries return instantly. Even with 100,000 messages, everything still feels snappy. The engineer deploys their code to production feeling confident.
Fast forward three months. The application now has 500 million messages stored in the database. Suddenly, everything falls apart:
Inserting a new message takes 350 milliseconds instead of 2 milliseconds
The database index has grown to 40 gigabytes and can barely fit in memory
Every time someone sends a message, the database has to reorganize parts of its index structure
The backup server falls 45 seconds behind because it can’t keep up with all the writes
During peak hours (6 PM to 11 PM), the database CPU maxes out at 100%
What went wrong? The database itself wasn’t broken. The problem was the fundamental architecture.
Understanding the Failure: Write Amplification
Here’s what happens behind the scenes when you insert a single 500-byte message into PostgreSQL with indices:
Step 1: Find the Right Place in the Index The database uses something called a B-Tree index. Think of it like a filing cabinet where everything needs to stay sorted. To insert a new message, the database first needs to find exactly where in this sorted structure the new data should go. This requires reading several pages from disk (5-15 milliseconds of waiting).
Step 2: Make Room and Rebalance Once it finds the right spot, the database might need to split data pages if they’re full. This is like when you’re organizing a binder and you have to move papers between sections to make room. This means more disk reads and writes.
Step 3: Update Multiple Indices Our table has two indices: one for channel_id and one for created_at. Each index needs its own update, which means doubling the work.
Step 4: Write to the Log For crash recovery, the database writes everything to a Write-Ahead Log first. More disk activity.
Let’s do the math on physical disk writes:
Message data: ~8 KB (one database page)
First index update: ~8 KB
Second index update: ~8 KB
Write-Ahead Log entry: ~8 KB
Total: 32 KB written to disk for every 500 bytes of actual user data
That’s a 64x write amplification factor. When you’re handling 100 million messages per day, this amplification turns into a serious problem:
User data per day: 50 GB
Actual disk writes per day: 3.2 TB
The disk subsystem becomes the bottleneck. Even modern SSDs struggle with this many random writes per second. Database checkpoint operations (where the database flushes dirty pages to disk) cause periodic freezes that users notice as “the app hanging.”
Why Frameworks Hide This Problem
If you’re using Spring Boot with JPA repositories, you might never see this coming. Your code looks clean:
@Entity
public class Message { ... }

messageRepository.save(message); // Looks simple!
Your local development environment with 10,000 test messages runs perfectly. The JVM heap is fine. Garbage collection is fine. Everything seems great until production traffic hits and your database silently dies.
This is why understanding what happens under the hood matters.
The Solution: LSM Trees and Wide-Column Stores
Now let’s talk about a completely different approach: Log-Structured Merge Trees (LSM Trees).
Instead of trying to keep everything sorted on disk all the time, LSM Trees make a clever trade-off:
The Big Idea:
Writes go to memory first (super fast)
When memory fills up, dump everything to disk in one sequential write (still fast)
Let background processes clean things up later (doesn’t slow down users)
Here’s how it works step by step:
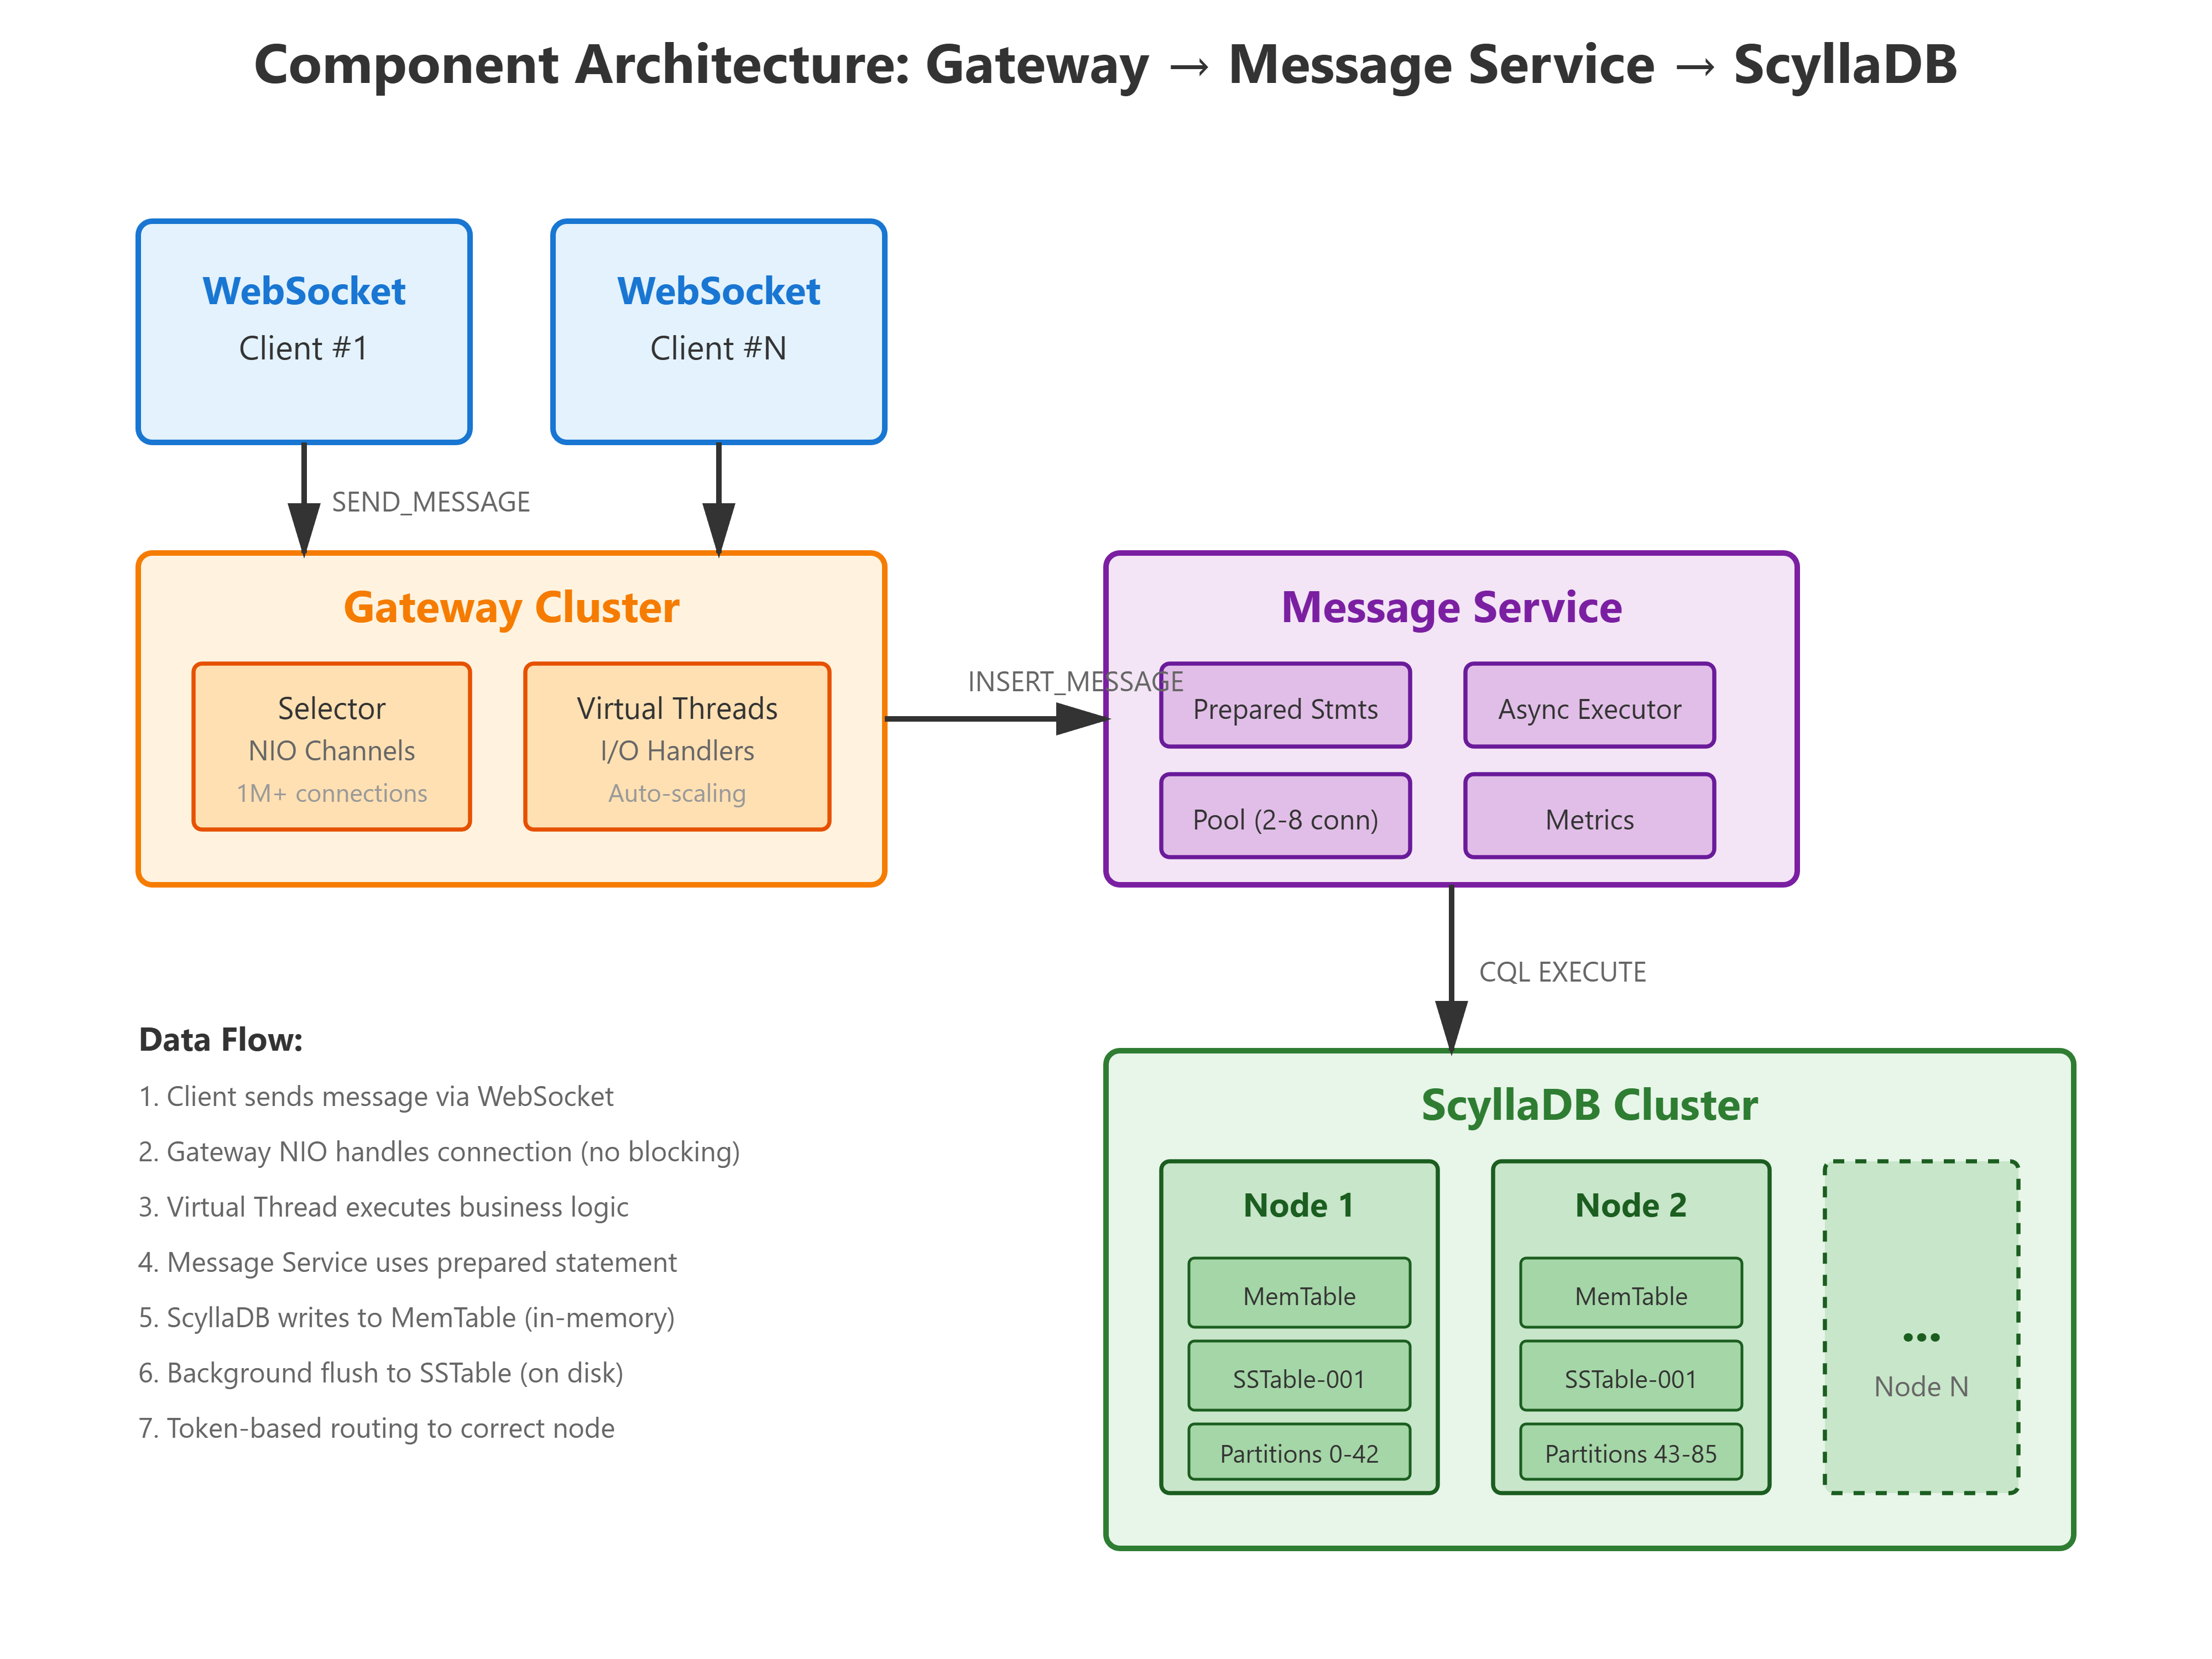
The Write Path
Step 1: Write to the CommitLog First, the data gets appended to a log file on disk. This is a sequential write (like writing to the end of a text file), which is incredibly fast compared to random writes. This step takes less than 1 millisecond and ensures we won’t lose data if the server crashes.
Step 2: Insert into MemTable The data also goes into an in-memory structure called a MemTable. Think of this as a sorted dictionary that lives in RAM. Inserting into a sorted structure in memory is extremely fast because there’s no disk involved.
Step 3: Return Success That’s it! We’re done. The user’s message is safely stored, and we can send back a success response. Total time: 1-5 milliseconds.
But wait, what about the disk? That happens in the background:
Background Step 4: Flush to SSTable When the MemTable gets full (around 128 MB), a background process dumps it to disk as an immutable SSTable (Sorted String Table) file. This is one big sequential write, which is very efficient.
Background Step 5: Compaction Over time, multiple SSTable files accumulate. Background processes periodically merge these files together, removing old versions of data and deleted entries. This keeps read performance from degrading.
Write Amplification Comparison
Let’s compare the two approaches:
PostgreSQL (B-Tree):
Every write touches multiple disk locations
Index maintenance requires random I/O
Write amplification: ~48x
ScyllaDB/Cassandra (LSM Tree):
Sequential log append: 1x
MemTable flush: 1x
Compaction overhead: ~5-10x over time
Total write amplification: ~10x
That’s almost 5 times less disk activity for the same data!