Day 58: Performance Tuning and Optimization - Hunting Down Bottlenecks
Real-World Context
When Netflix’s task scheduler started experiencing mysterious slowdowns during peak hours, their engineers didn’t guess—they profiled. They discovered that a seemingly innocent logging operation was creating 400,000 temporary objects per second, triggering constant garbage collection pauses. After optimization, throughput jumped from 12,000 to 85,000 tasks per second.
Uber’s payment reconciliation scheduler faced similar challenges. Their initial implementation could barely handle 5,000 transactions per second, causing payment delays during rush hours. Profiling revealed database connection pool exhaustion and inefficient JSON serialization. Post-optimization, they achieved 50,000+ transactions per second with lower latency.
This lesson teaches you to become a performance detective, using JVisualVM to uncover hidden bottlenecks and apply targeted optimizations that transform struggling systems into high-performance machines.
The Performance Tuning Mindset
Performance optimization isn’t about making everything faster—it’s about identifying what matters and optimizing those specific paths. Premature optimization wastes time; informed optimization based on profiling data delivers results.
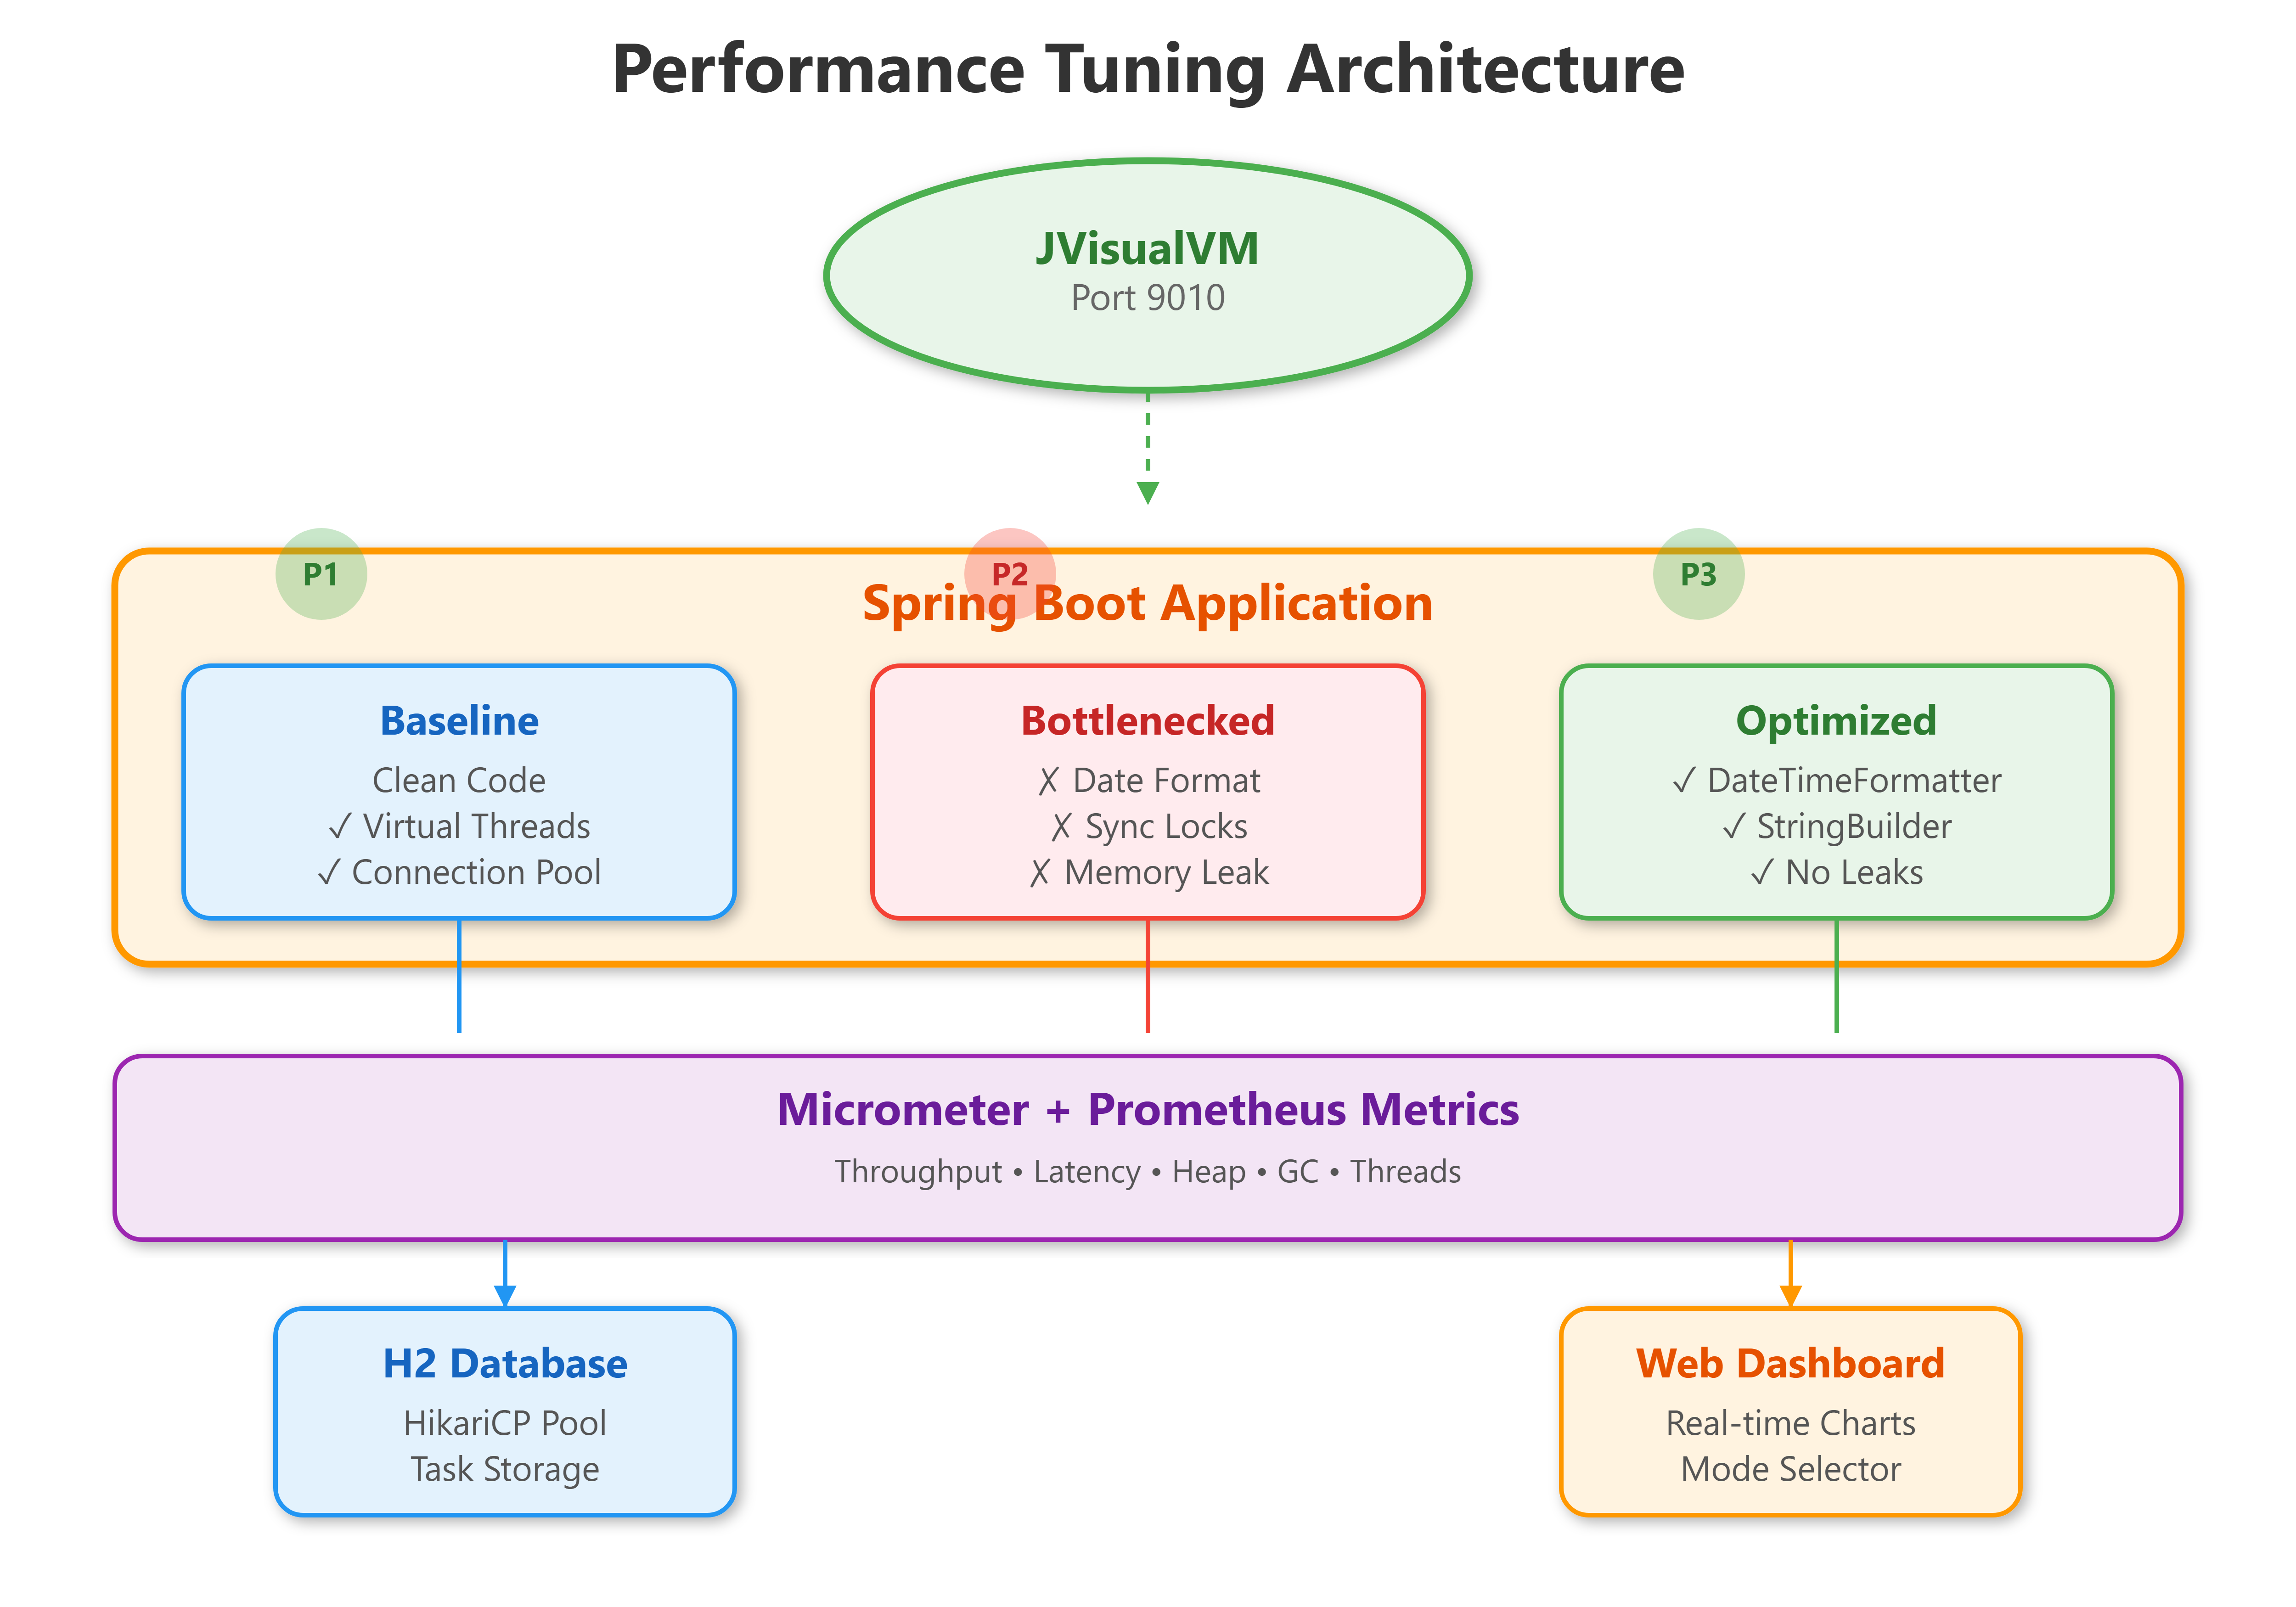
Why JVisualVM?
JVisualVM provides real-time insights into your running JVM applications:
Heap usage patterns revealing memory leaks
CPU hotspots showing which methods consume processing time
Thread states exposing deadlocks and contention
Garbage collection behavior indicating memory pressure
Unlike guesswork, profiling gives you concrete data about where your application spends time and resources.
Common Bottleneck Patterns in Task Schedulers
1. Database Connection Pool Starvation
Symptom: Tasks pile up in queue while CPU sits idle.
Stripe’s billing scheduler hit this. With only 10 database connections and 100 concurrent tasks, 90 tasks waited for connections. Profiling showed threads blocked on HikariPool.getConnection().
Solution: Increased pool size to match Virtual Thread concurrency, added connection timeout monitoring.
2. Inefficient Object Allocation
Symptom: High GC pause times, sawtooth heap pattern.
Spotify’s playlist update scheduler created new SimpleDateFormat instances for every task (they’re not thread-safe). With 50,000 tasks per minute, this generated massive temporary objects.
Solution: Used thread-local DateTimeFormatter or switched to Java 21’s built-in formatters, eliminating object churn.
3. Synchronization Bottlenecks
Symptom: Low CPU utilization despite available work.
DoorDash’s delivery scheduler used synchronized blocks for updating task metrics. With 1000 Virtual Threads, contention created a bottleneck—threads waited for locks instead of executing tasks.
Solution: Migrated to LongAdder for counters, eliminated unnecessary synchronization.
4. Inefficient Serialization
Symptom: High CPU usage in specific methods.
Amazon’s inventory scheduler spent 40% of CPU time in Jackson JSON serialization. Each task result (simple success/failure) serialized the entire context object unnecessarily.
Solution: Created lightweight DTOs for serialization, used protobuf for high-frequency operations.