

The Spring Boot Trap
The lazy version of “monitor call quality” is a counter. Increment packetsReceived on every RTP packet, expose it on a /metrics endpoint, call it observability. It tells you throughput. It tells you nothing about whether the call sounded good, because a counter that only goes up can’t express “I expected 500 packets in the last 10 seconds and got 470.” You need to know what was expected, not just what arrived — which means confronting the exact 16-bit rollover problem this course has now hit twice: RTP sequence numbers wrap at 65,536, and a receiver has to reconstruct the unwrapped count to know how many packets it was supposed to see.
Jitter is worse, because there’s no obvious counter for it at all. A junior instinct here is to log the delta between consecutive packet arrival times and eyeball it, or average the inter-arrival gaps. Neither one is what RFC 3550 means by jitter, and the difference isn’t pedantic — the spec’s definition is the smoothed variance in transit time (arrival time minus the packet’s own RTP timestamp), not the raw gap between arrivals. A stream that’s perfectly regular but running 40ms behind schedule has zero jitter by the correct definition and would look alarming under a naive “gap between arrivals” metric. Getting this wrong doesn’t just produce a slightly-off number; it produces a metric that alerts on the wrong thing.
The Failure Mode
Skip proper loss tracking and the failure isn’t a crash, it’s a blind spot. Everything looks fine on your dashboards — connections up, bytes flowing, CPU nominal — while users get choppy audio because 8% of packets are dropping somewhere between the SFU and their laptop. Nobody notices until support tickets pile up, and by then you’re debugging after the fact with no historical loss data to correlate against the incident window.
Get loss tracking right but skip the interval-vs-cumulative distinction and you get a subtler failure: a report that says “3% packets lost” forever, even after the network problem clears, because you’re reporting total-loss-since-the-start-of-the-call instead of loss-since-the-last-report. A five-minute call with a rough 30-second patch in the middle should show quality recovering afterward — if fraction-lost never resets, it can’t, and every report from that point on looks equally bad regardless of current conditions.
There’s a genuinely nasty concurrency failure mode too, easy to miss because it only shows up under real load: if multiple worker threads can process packets for the same SSRC (a sharded ingest design, or packets arriving fast enough that consecutive ones land on different pool threads), a sequence tracker built with a plain if (seq > highest) highest = seq loses updates under concurrent access — two threads read the same stale highest, both compute they should advance it, one write clobbers the other. It doesn’t show up in a single-threaded test. It shows up as inexplicably low sequence numbers under production traffic, and it’s miserable to track down after the fact.
The Flux Architecture
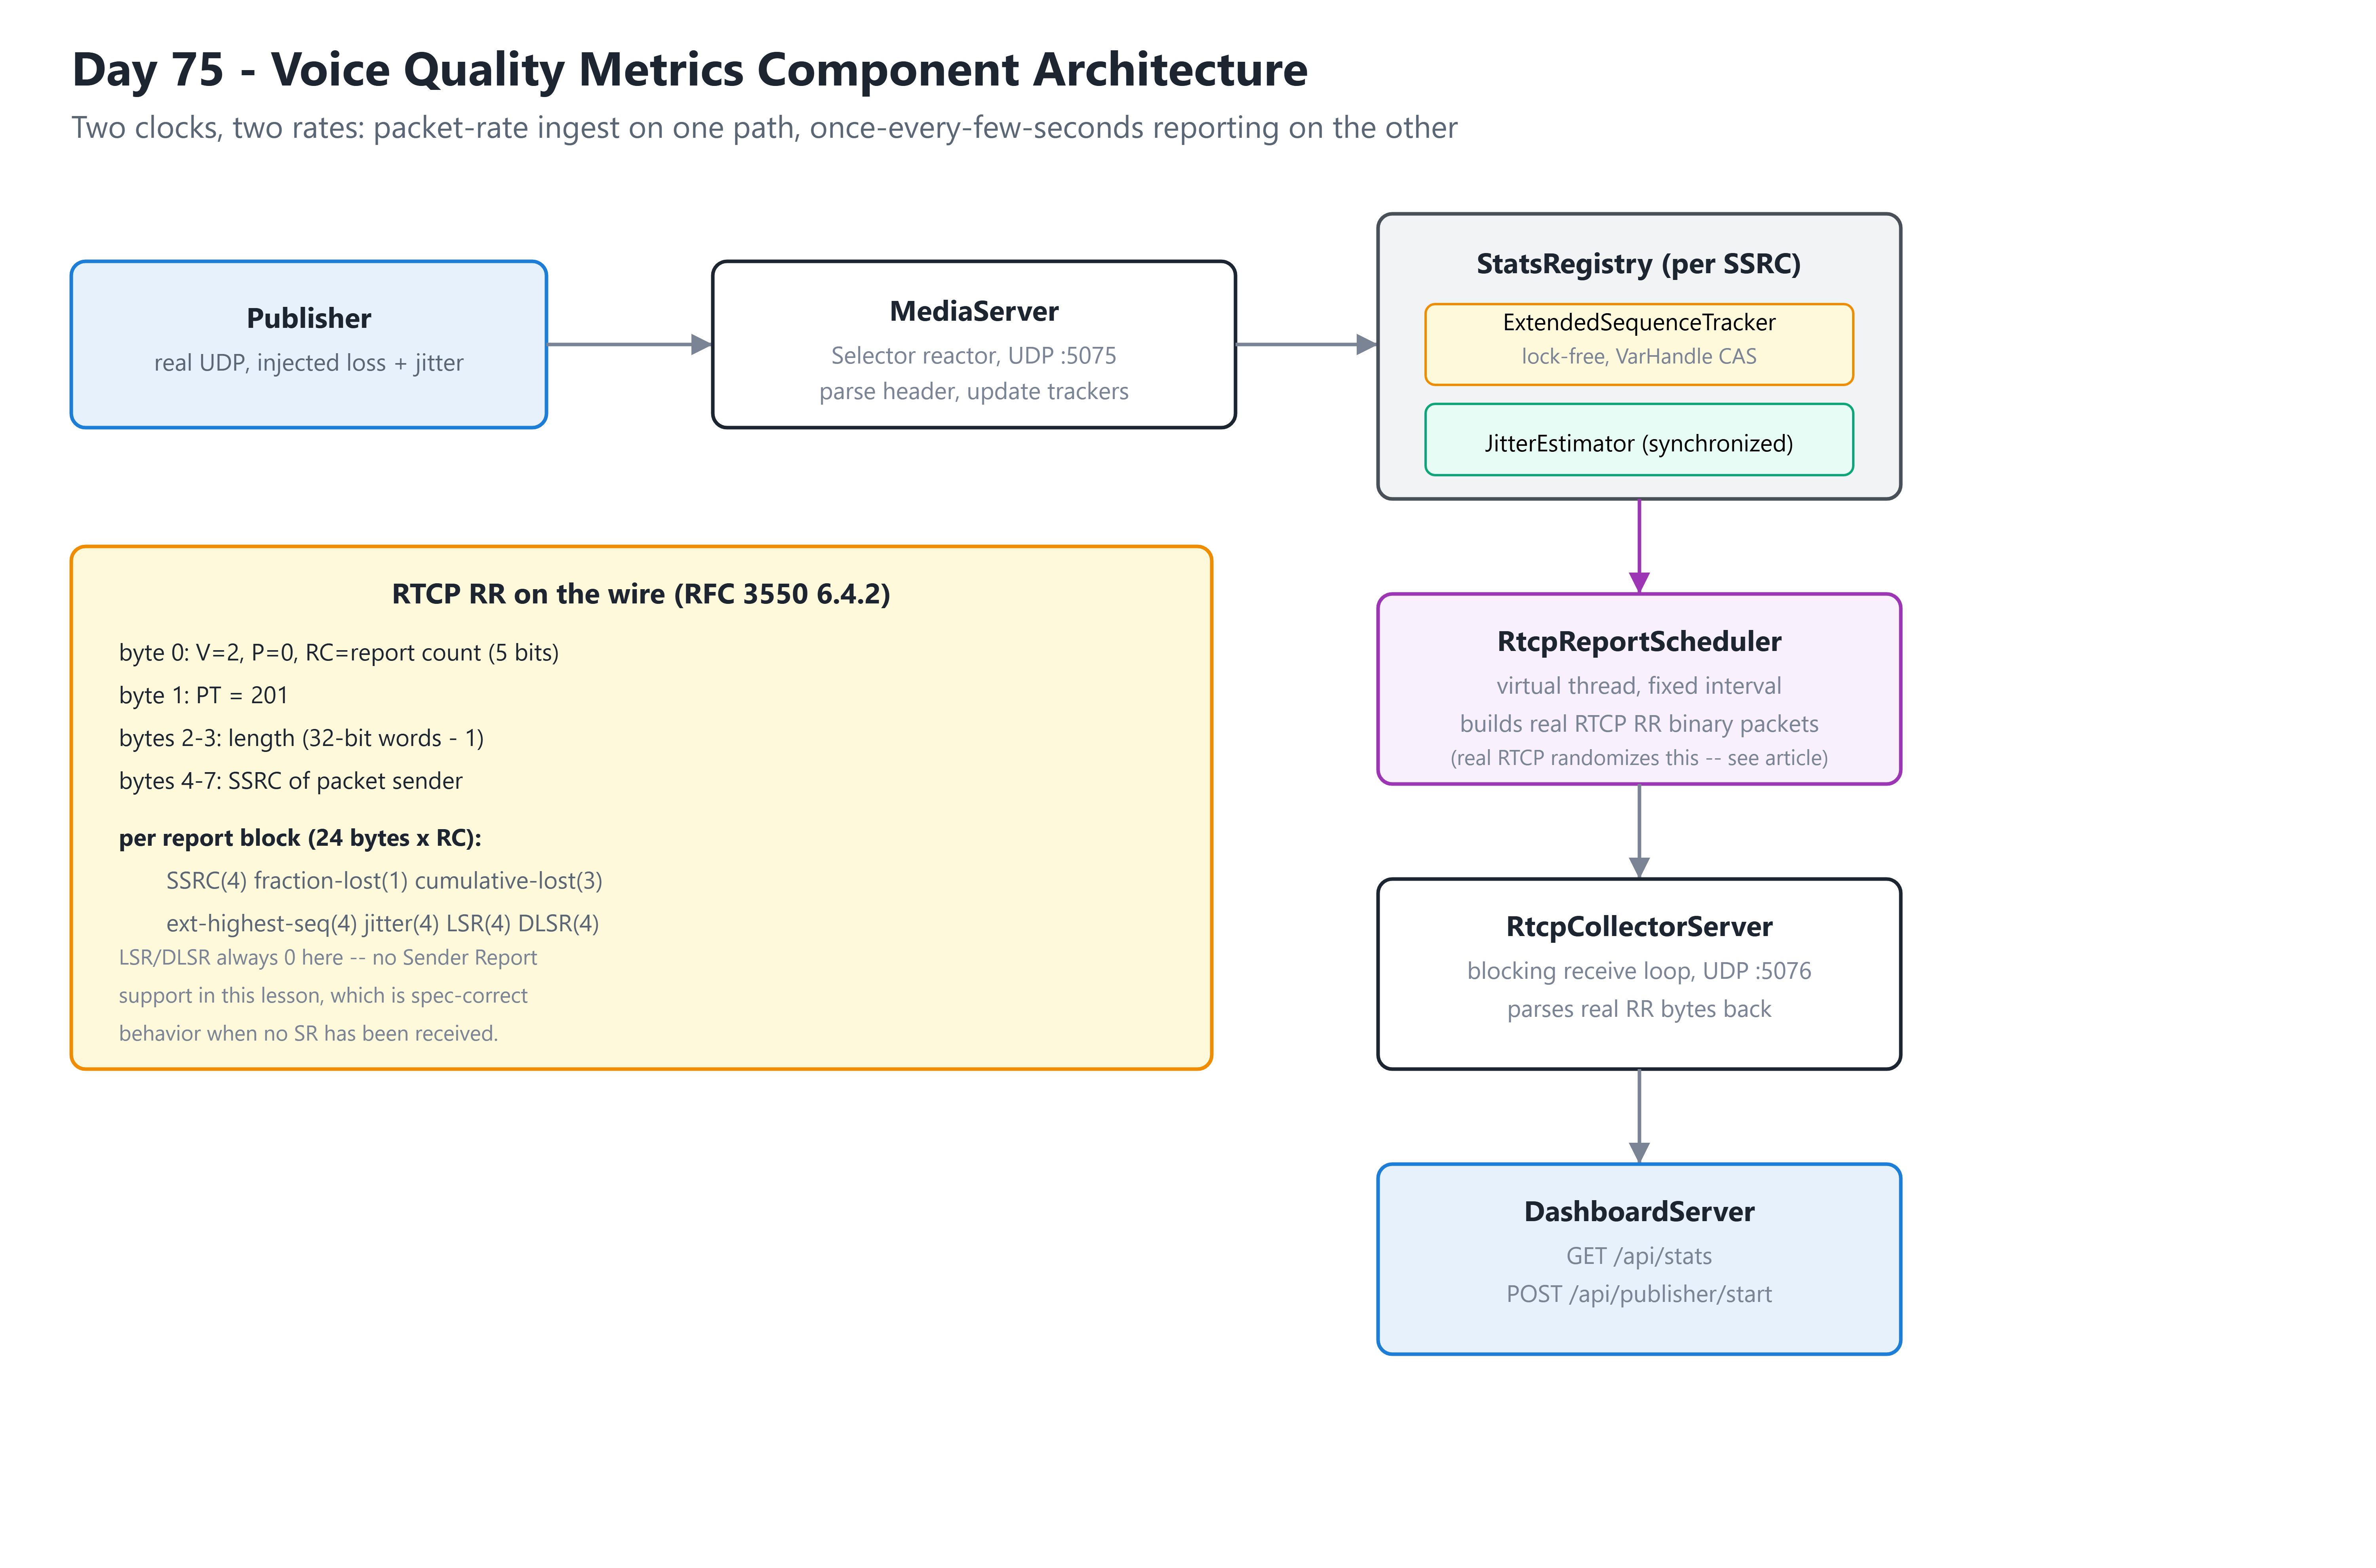
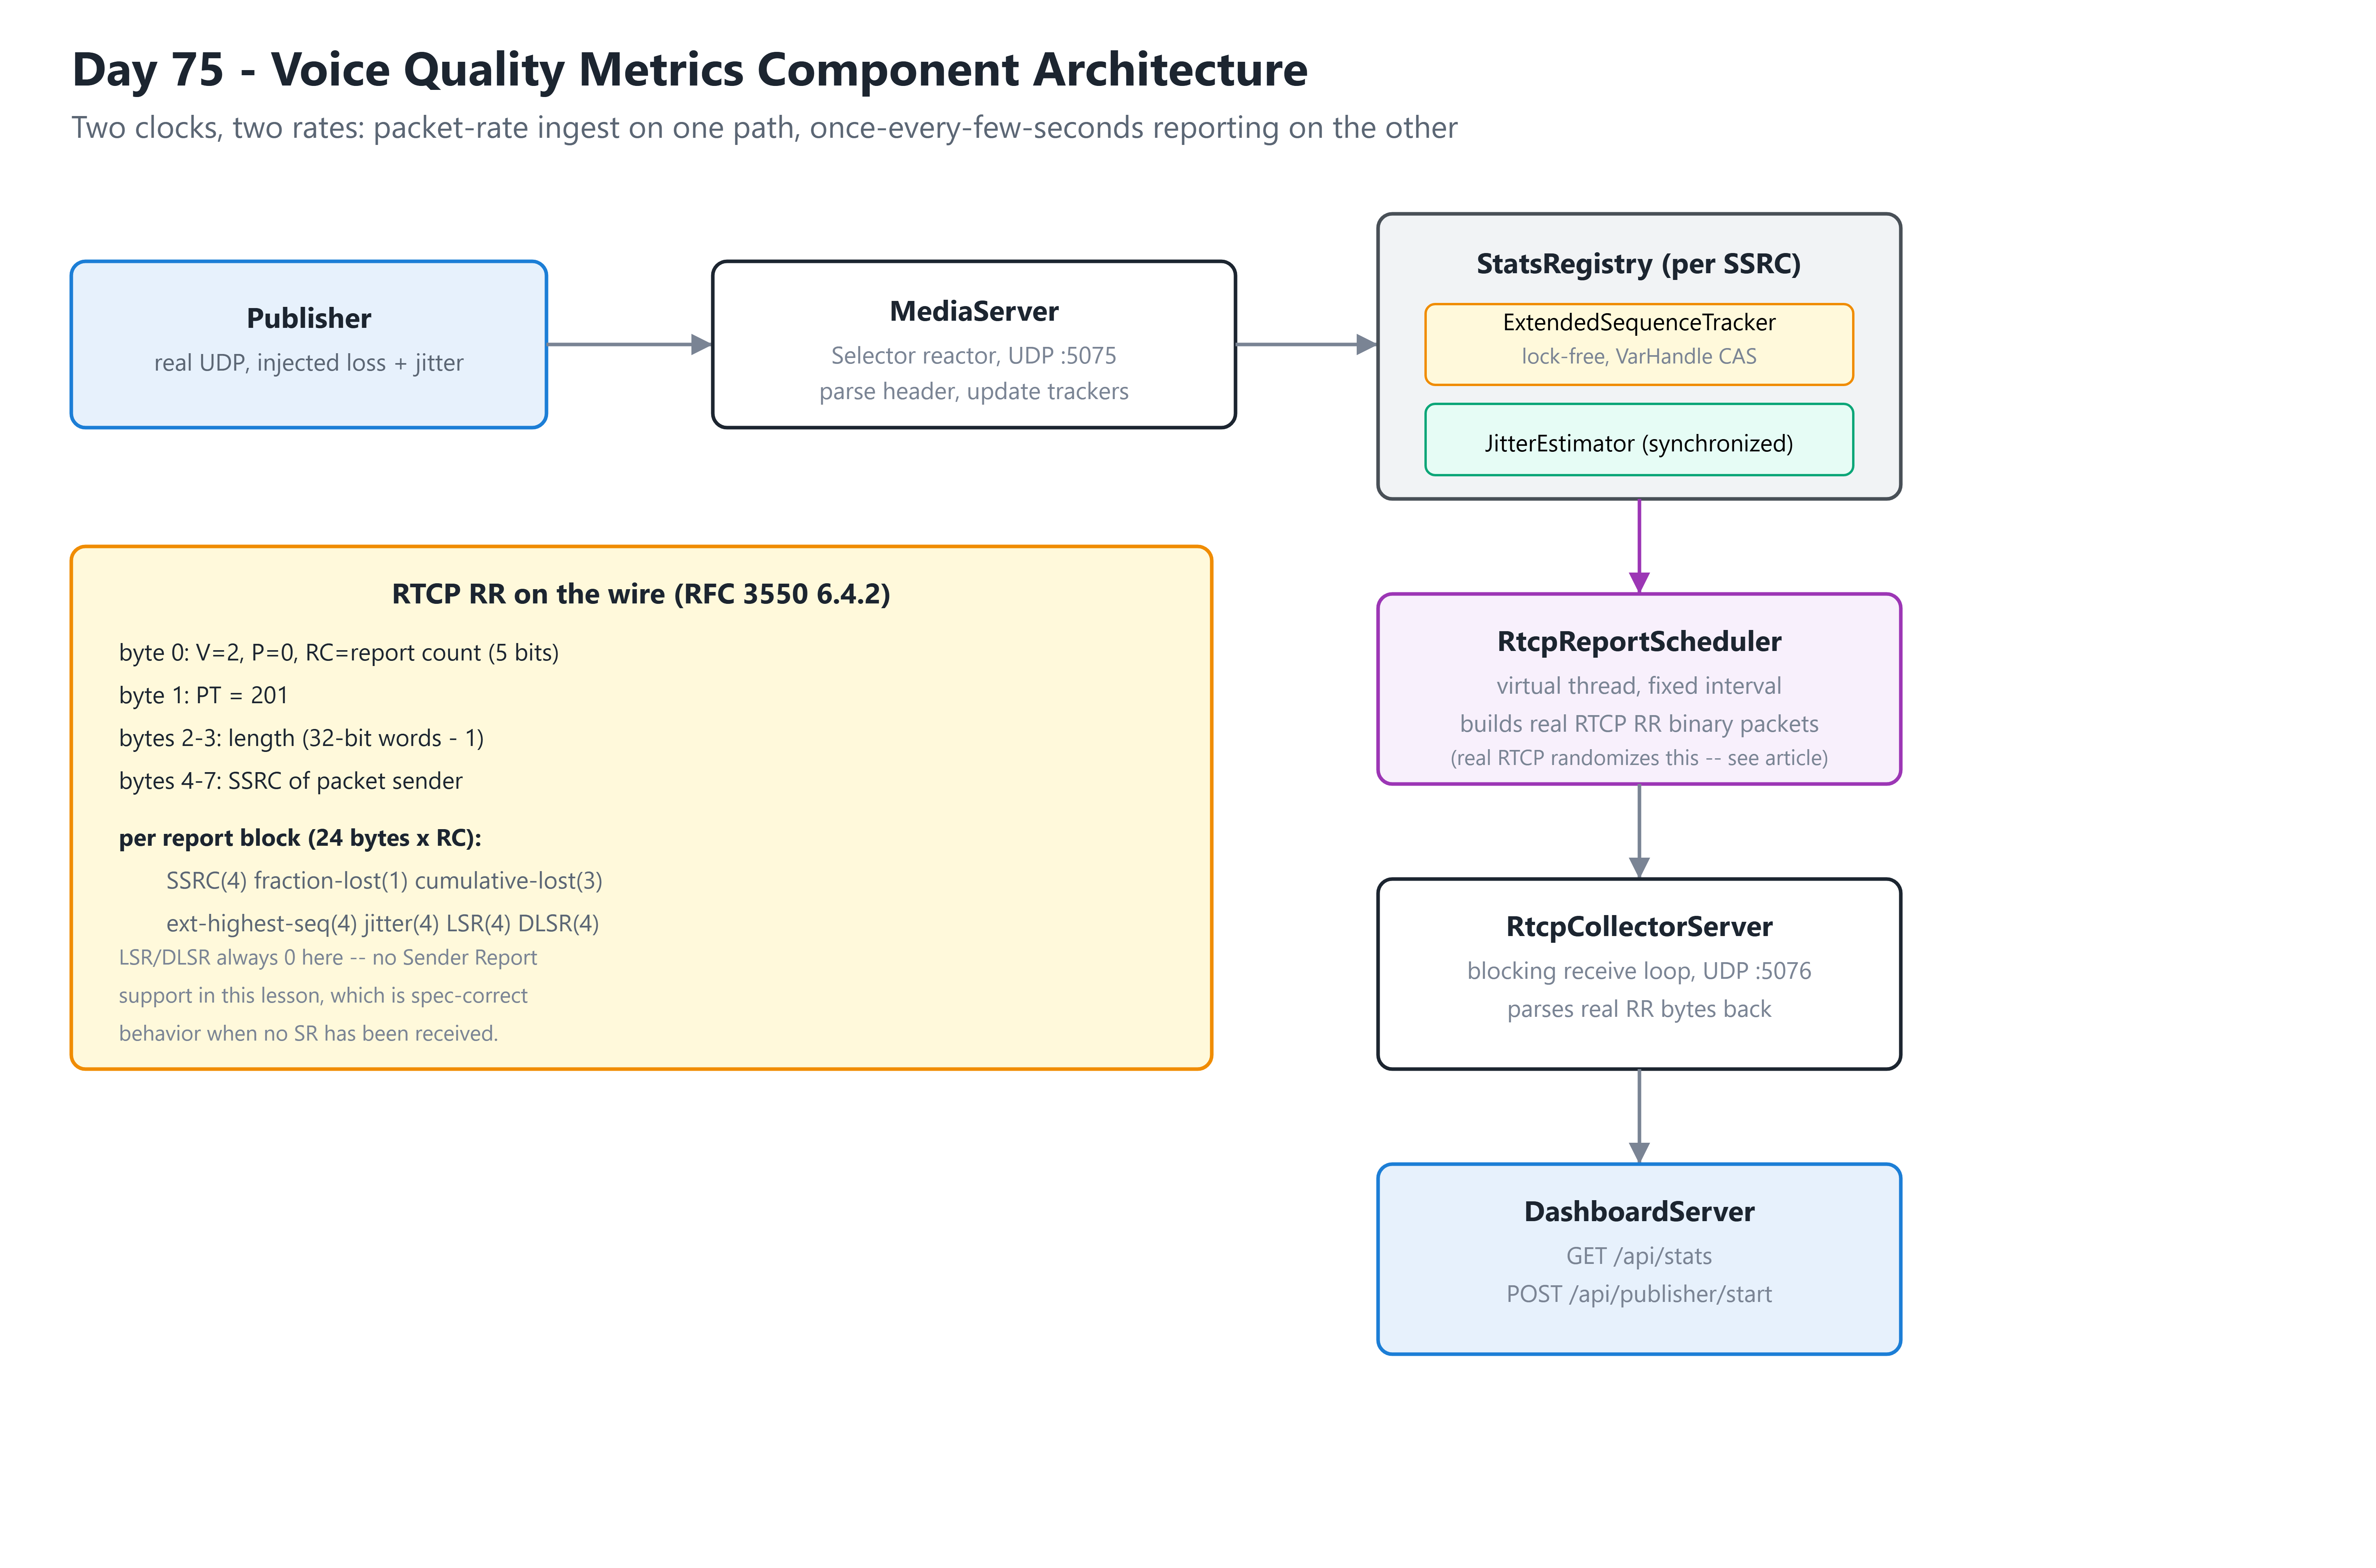
Two independent trackers per SSRC, each earning its own concurrency strategy rather than defaulting to the same one out of habit. ExtendedSequenceTracker gets a genuine lock-free CAS retry loop on a single VarHandle-guarded field, because the value it protects — the highest extended sequence number seen — is a single number multiple threads could plausibly race to advance, and CAS is exactly the right tool for “read, compute a candidate, try to install it, retry if someone beat you to it.” JitterEstimator gets a synchronized method instead, because its state is two numbers (the previous transit time and the running jitter estimate) that only make sense updated together as one atomic step — CAS doesn’t compose cleanly across two independent fields without packing them into one artificial value, and forcing that just to avoid the word synchronized would be complexity for its own sake. Contention is per-SSRC either way, not global, so neither choice becomes a bottleneck.
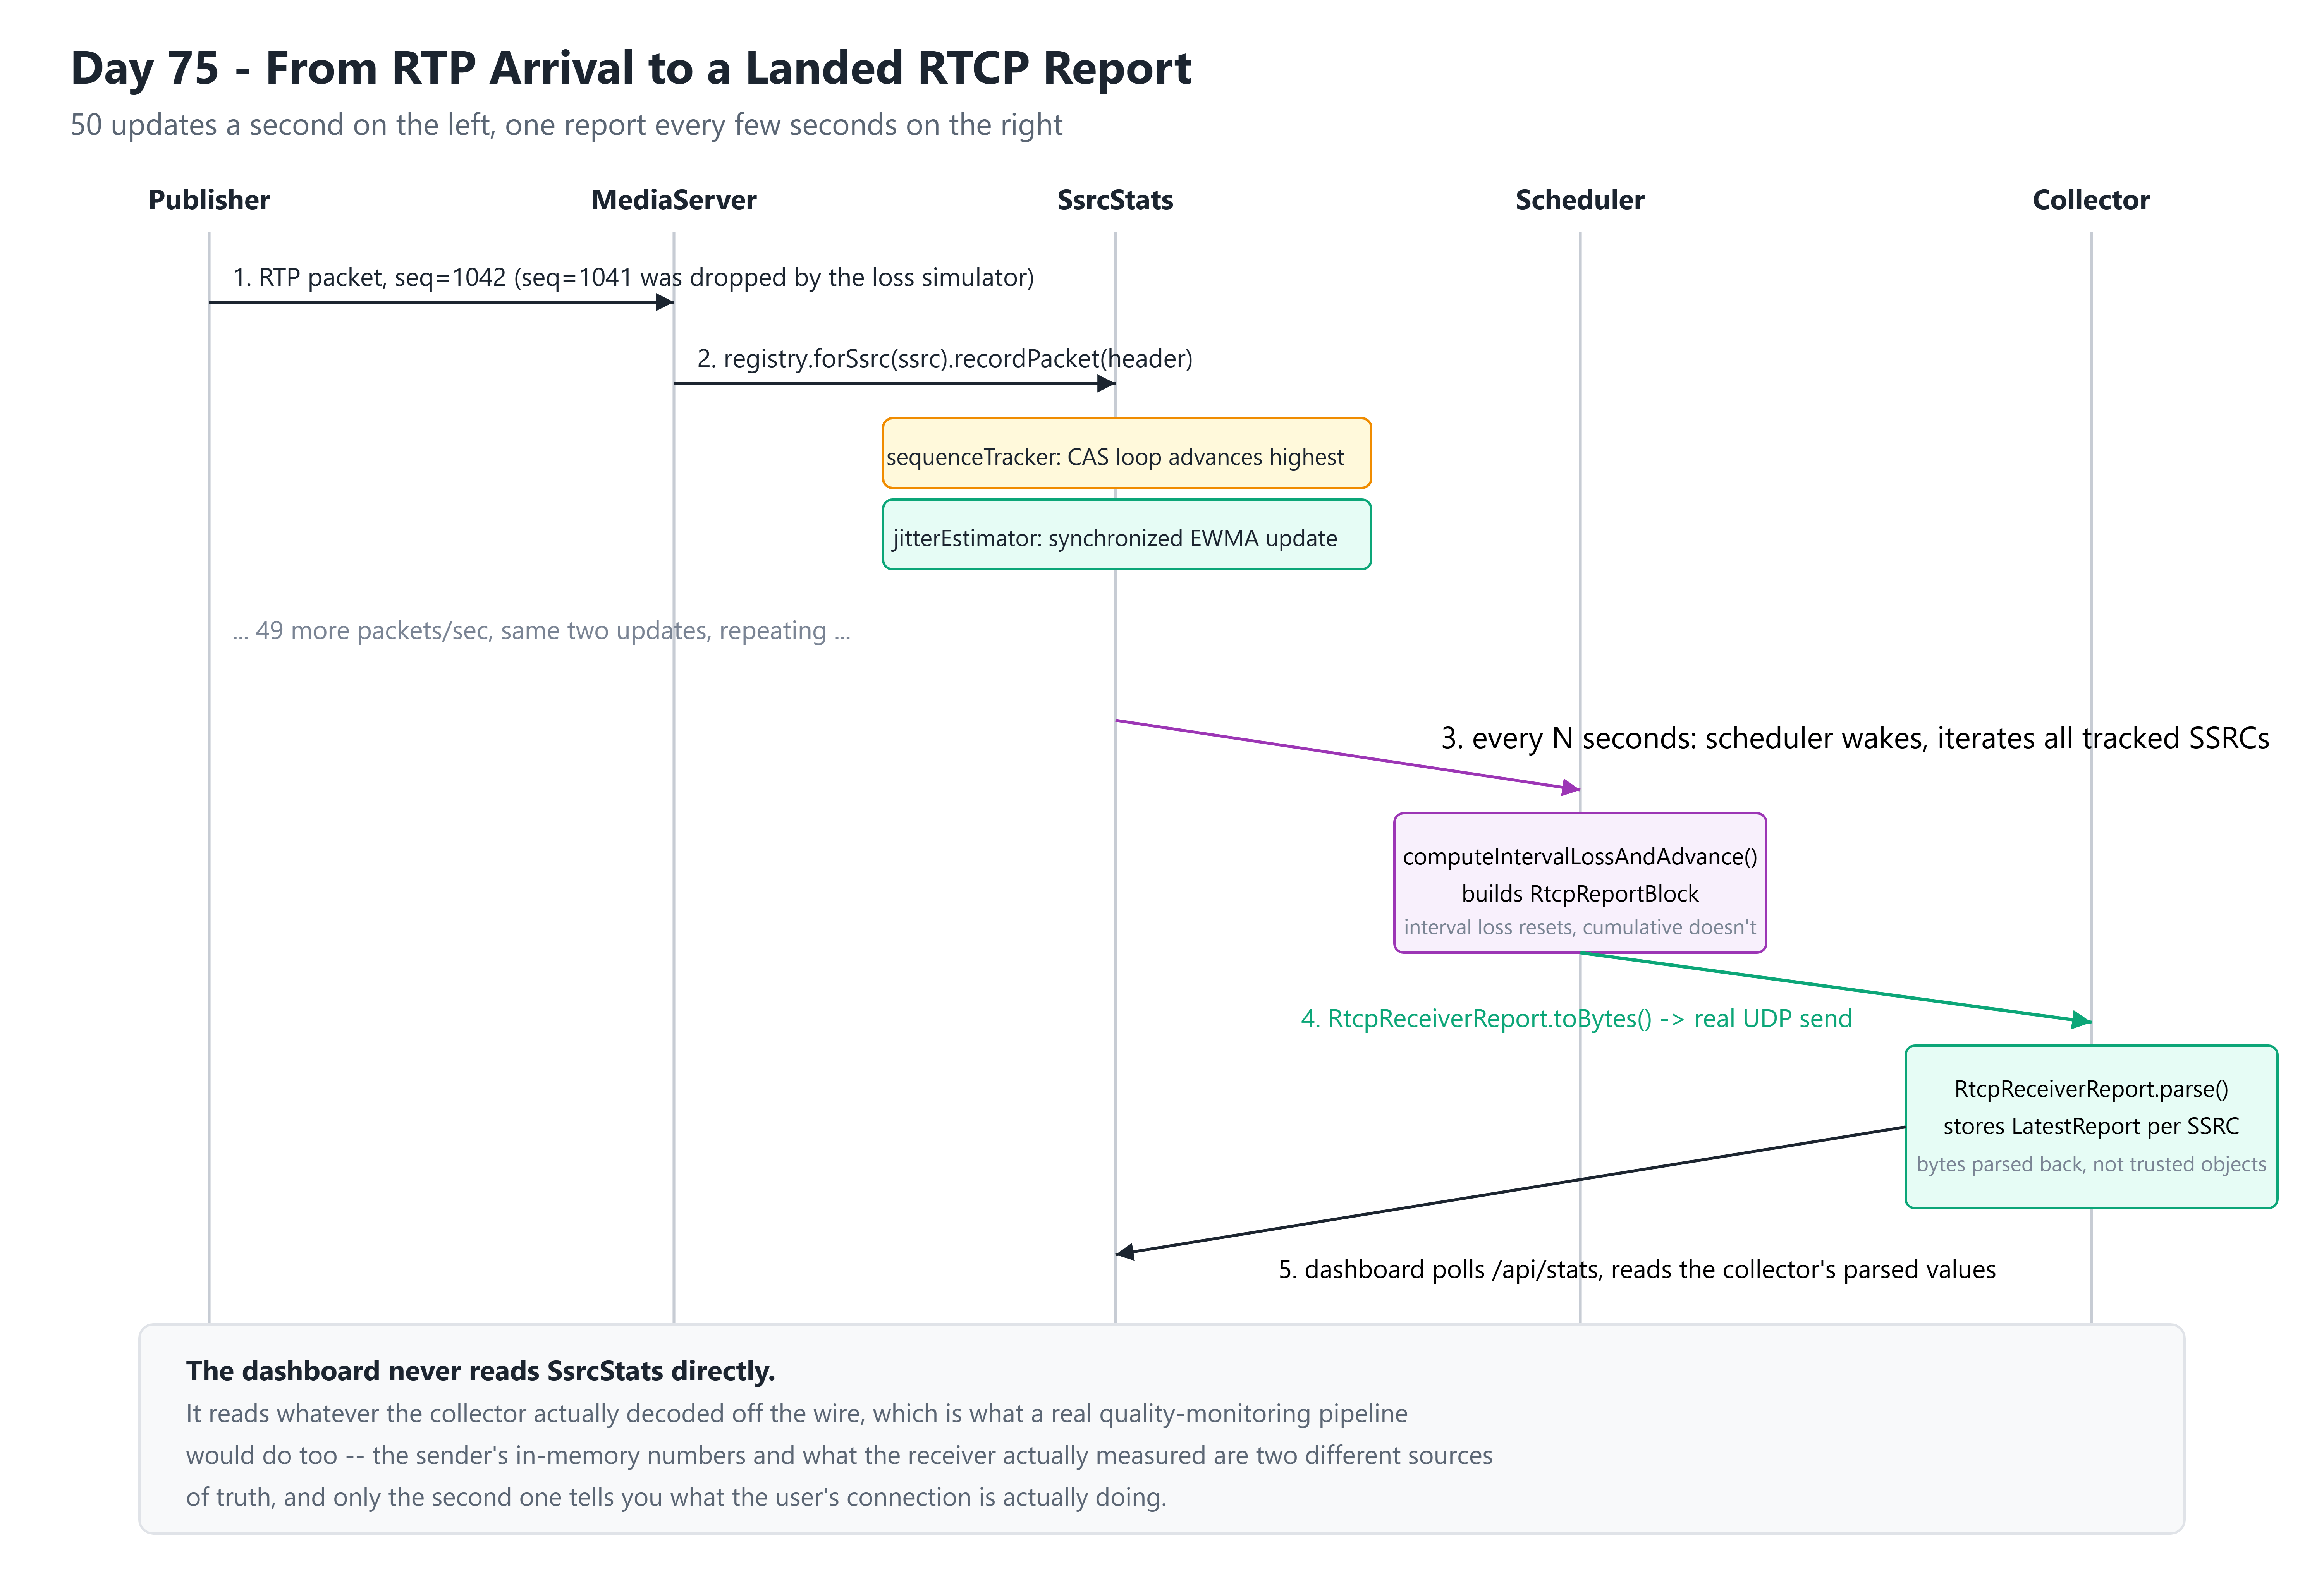
The reporting side runs on its own clock, deliberately decoupled from the packet-rate ingest path. RtcpReportScheduler wakes on a fixed interval, and every one of its report-generation calls is the only thing that ever calls computeIntervalLossAndAdvance() — meaning the “since last report” bookkeeping never has to worry about being invoked concurrently with itself, even though the packet-ingest side updating the underlying counters absolutely is concurrent. Real RTCP doesn’t use a fixed interval at all — RFC 3550’s reconsideration algorithm randomizes each participant’s report timing by roughly 5% specifically so a large session’s receivers don’t all report in the same instant and cause a synchronized burst of RTCP traffic on top of the media traffic. This lesson uses a fixed interval because it’s easier to reason about while you’re learning the packet format; a production implementation can’t afford to skip the randomization once the session size grows past a handful of participants.
Implementation Deep Dive
Github Link:
https://github.com/sysdr/discord-flux-p/tree/main/day75
The exact RFC 3550 jitter formula, not an approximation of it. JitterEstimator.recordArrival() computes transit = arrival - timestamp, then updates J += (|D| - J) / 16 where D is the change in transit time between consecutive packets. That 1/16 gain factor is the literal constant from RFC 3550 Appendix A.8, chosen by the spec authors to balance responsiveness against noise — verified in this lesson’s test suite against hand-computed values, not just checked for “a plausible-looking number came out.”
Real RTCP RR packets, byte for byte. RtcpReceiverReport.toBytes()/.parse() implement the actual RFC 3550 section 6.4.2 binary layout: a 4-byte common header (version, padding, report count, packet type 201), the reporter’s own SSRC, then 24-byte report blocks each carrying SSRC, fraction lost, cumulative lost, extended highest sequence, jitter, and LSR/DLSR. This lesson skips Sender Report support (that needs NTP wall-clock correlation to compute round-trip time, its own substantial chunk of work), so LSR and DLSR are always zero — which isn’t a shortcut, it’s exactly what RFC 3550 specifies for a receiver that hasn’t gotten a Sender Report yet.
Interval loss that actually resets. ExtendedSequenceTracker.computeIntervalLossAndAdvance() snapshots the current expected/received totals, diffs them against the values saved at the last report, and advances the baseline for next time — so fractionLost genuinely reflects “since the last report,” while cumulativeLost stays a running total for the whole call. Two different numbers, two different questions, and RTCP’s wire format has a field for each because both are useful and neither substitutes for the other.
The snapshot isn’t perfectly atomic, and that’s fine. Reading expected-total and received-total isn’t a single transactional operation — a packet can land in the gap between those two reads and shift the picture by one. For a monitoring metric summarizing the last few seconds of a call, that’s an acceptable amount of fuzziness, not a correctness bug. Treating RTCP stats as a ledger that needs perfect consistency is over-engineering something that’s supposed to be a best-effort snapshot.
Working Code Demo:
Production Readiness
Fraction lost per interval, not just cumulative. Cumulative loss tells you how bad the whole call was. Interval loss tells you whether it’s bad right now, which is the number that should actually page someone.
Jitter buffer depth alongside raw jitter. The jitter estimate this lesson computes is upstream of any buffering decision — pair it with whatever depth your jitter buffer is actually running at to see whether the buffer is keeping up or constantly under- and over-running.
RTCP report delivery itself. If reports stop arriving for a source that’s still sending RTP, that’s not “the call got quiet,” that’s “something broke in the reporting path,” and it deserves its own alert distinct from a genuinely bad-quality report.
Concurrent update correctness under real load, not just single-threaded tests. A sequence tracker that passes every unit test run single-threaded can still silently drop updates under production concurrency. Test the lock-free path with genuine concurrent load, the way this lesson’s own test suite does (thousands of packets across dozens of virtual threads, asserting nothing gets lost), not just with sequential calls.
<!-- IMAGE: diagram_01_component_architecture.svg --> <!-- IMAGE: diagram_02_packet_flow_sequence.svg --> <!-- IMAGE: diagram_03_quality_state_machine.svg -->
Step-by-Step Guide
Prerequisites
Java 21+ (JDK, not just JRE)
Maven 3.9+
VisualVM or
jconsolecurlandpython3(the verification script uses both)
Execution
chmod +x project_setup.sh
./project_setup.sh flux-day75-voice-quality
cd flux-day75-voice-quality
./start.sh
This builds the project and starts the RTP media reactor (port 5075), the RTCP collector (port 5076), the report scheduler, and the dashboard on port 8075.
Verification
Open
http://localhost:8075
. Start a publisher with 0% loss and 0ms jitter, then a second one with meaningful loss and jitter injected. Within a couple of report intervals, the clean stream’s tile should read “Excellent” with near-zero numbers, and the degraded one should show real measured loss and jitter climbing toward “Fair” or “Poor” — numbers produced by actual dropped UDP packets and randomized send timing, not canned values.
Then run ./verify.sh, which runs the JUnit suite (RTCP RR binary round-trip, sequence tracker wraparound and concurrent-update correctness, the jitter formula checked against hand-computed values) and confirms the same clean-vs-degraded behavior live over HTTP against the running server.
Or run java -cp target/classes com.flux.rtcp.LoadGenerator 30 20 to swarm 30 simulated publishers with randomized loss/jitter profiles against a standalone pipeline and print the final per-SSRC reports the collector actually received.
Homework
Beginner: QualityClassifier‘s thresholds are hardcoded constants. Make them configurable, and add a fifth tier below “Poor” for a stream that’s stopped reporting entirely (distinguish “bad connection” from “no connection”).
Intermediate: Add hysteresis to the quality classification so a stream sitting right at a threshold boundary doesn’t flap between two labels every report interval — require N consecutive reports in the new bucket before the displayed classification actually changes, the same debounce idea Day 71’s speaking detector used for a different signal.
Expert: Implement Sender Report support (RTCP packet type 200) alongside the existing Receiver Report, correlating a received SR’s NTP timestamp with the DLSR field on your next RR to compute actual round-trip time. This is the piece this lesson deliberately left out — the LSR/DLSR fields have been sitting there at zero the whole time, waiting for it.